Telemetry
What official DBTrail binaries report, what they never report, and how to turn it off from the CLI, an environment variable or the web console.
Official release binaries send metadata-only usage statistics: which command ran, whether it worked, a coarse error class, version and platform. On by default in official builds. One step turns it off.
Turn it off
Console: This daemon page → Usage telemetry → toggle. It stops the
daemon's beacons immediately and records the same machine-wide choice as
bintrail telemetry off. A flag or variable on the daemon overrides the
toggle, and the card says which.
bintrail telemetry off      # this account, permanently
DO_NOT_TRACK=1              # every tool that honours the convention
BINTRAIL_TELEMETRY=off      # this environment (systemd unit, compose .env)
bintrail --telemetry=off …  # one command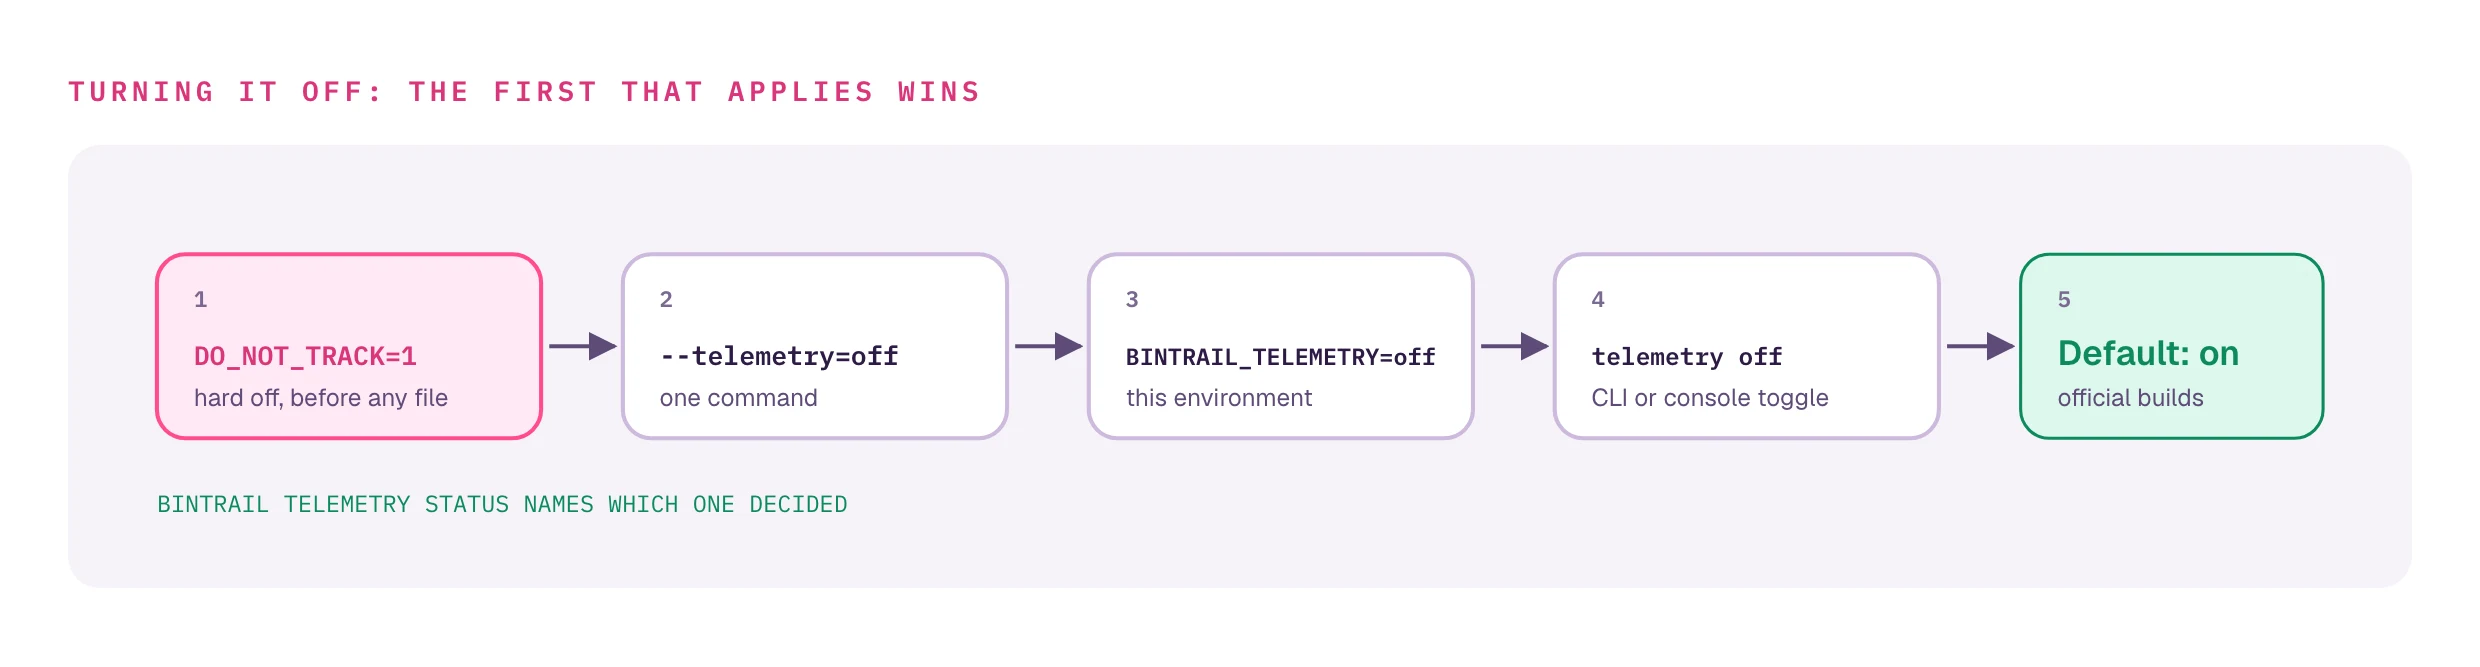
What is sent
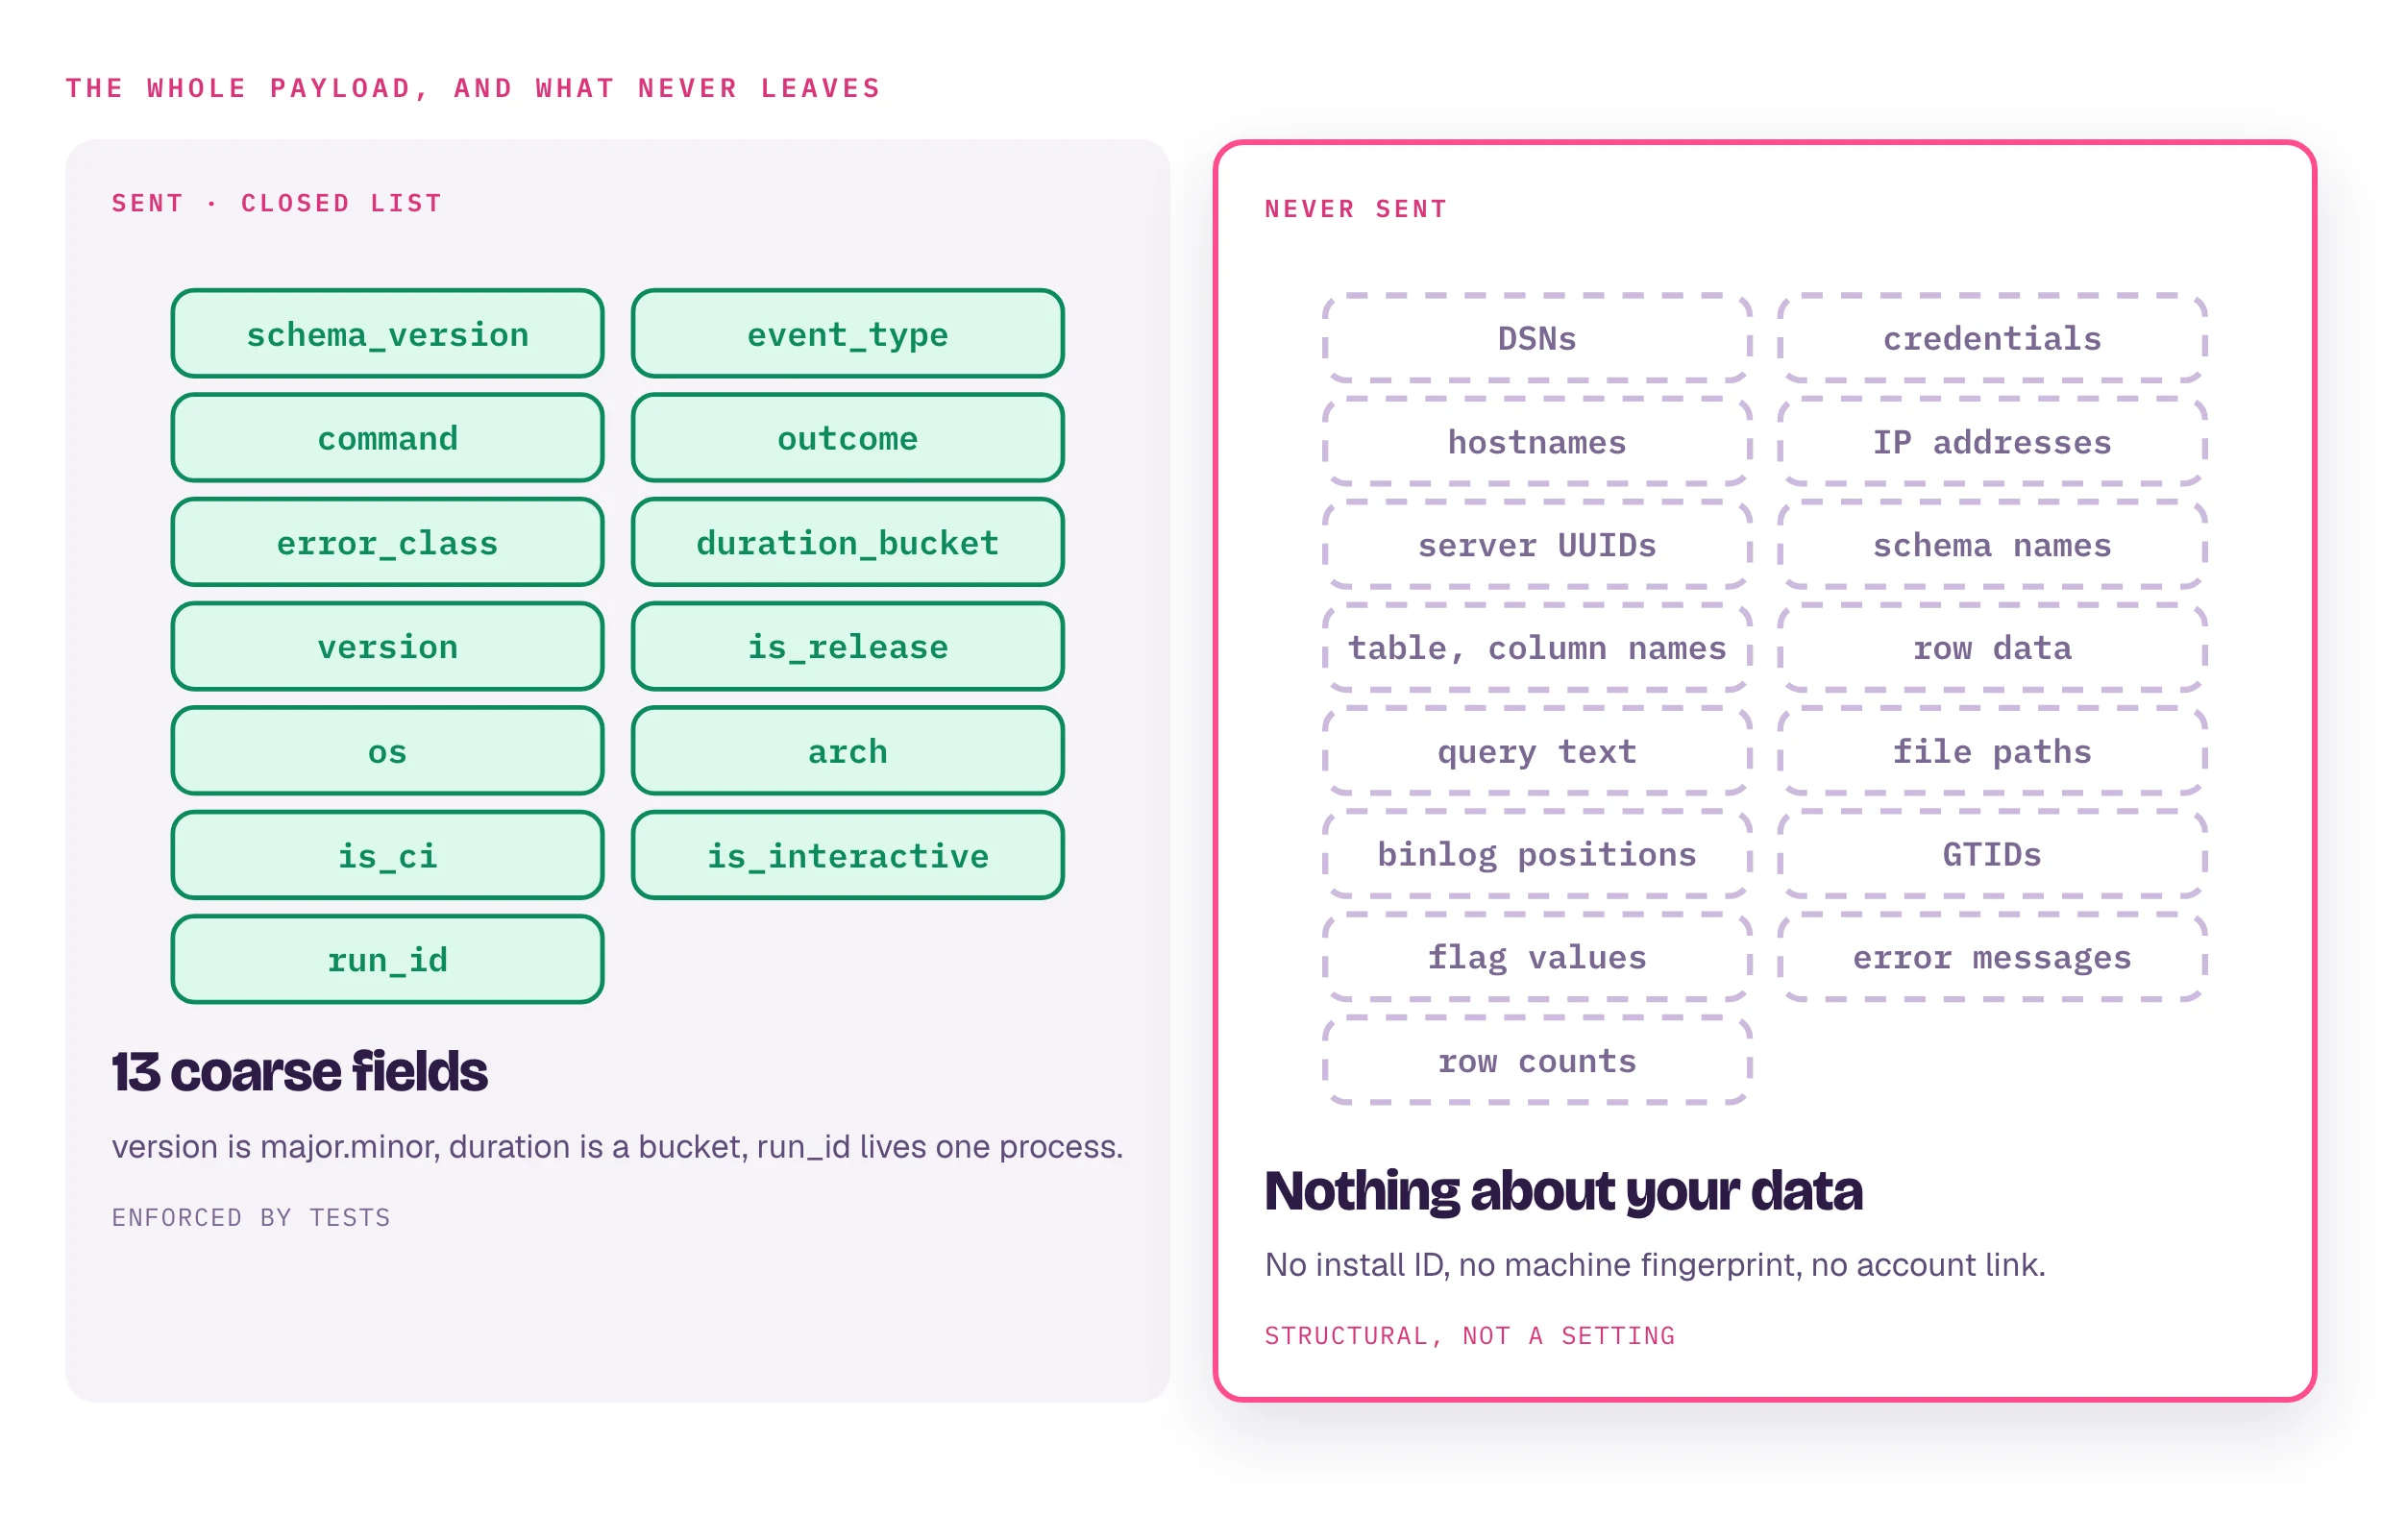
error_classis one ofdb_connection,db_permission,binlog_not_found,schema_mismatch,config_invalid,storage_io,not_found,internal. Never the message.run_idis created in memory for one command run so ingestion can drop a re-sent batch. Beacons and console events carry none. Nothing identifies the install.- See the exact bytes first; neither sends anything:
bintrail telemetry show     # a sample event, byte for byte
bintrail telemetry status   # on or off, and what decided that
Console: Usage telemetry → Show a sample event.
How it is sent
- Spool:
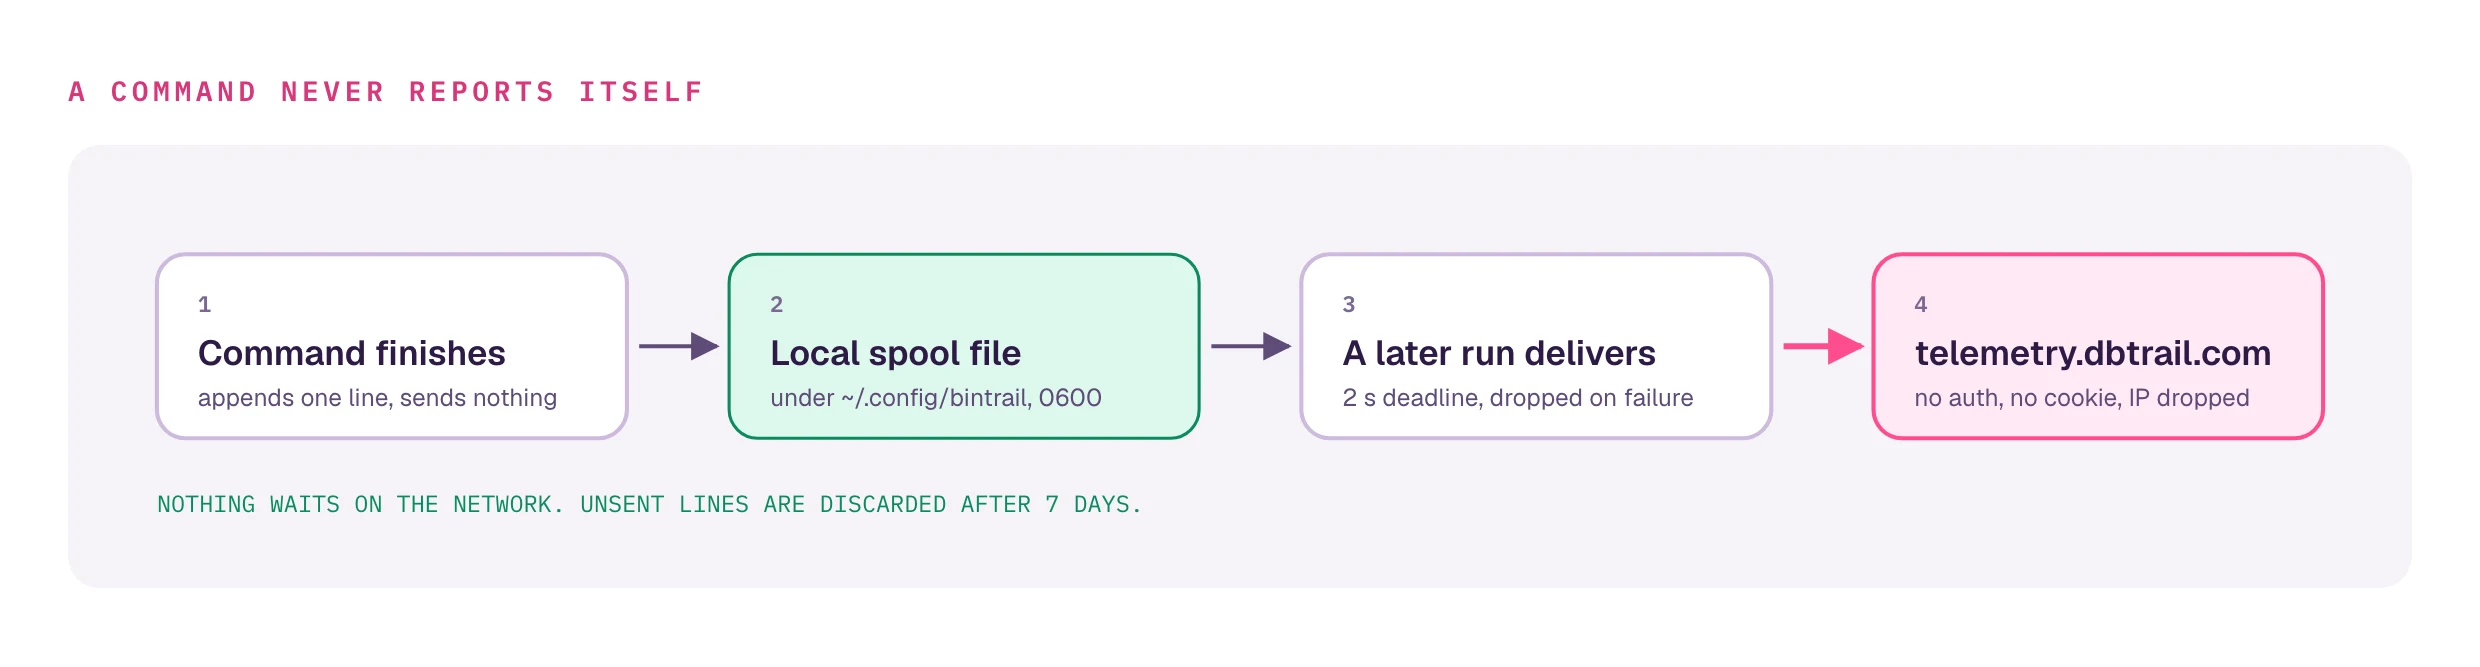
~/.config/bintrail/telemetry-spool/<date>.ndjson, capped at 5 MB a day. A failed delivery is dropped, never retried. - Endpoint:
https://telemetry.dbtrail.com, separate from the authenticated API, noAuthorizationheader, no cookie. - Operational commitments, not checkable in code: source IPs are dropped or truncated at the edge before anything is stored, and raw events are kept at most 90 days.
Who reports
- Daemons (
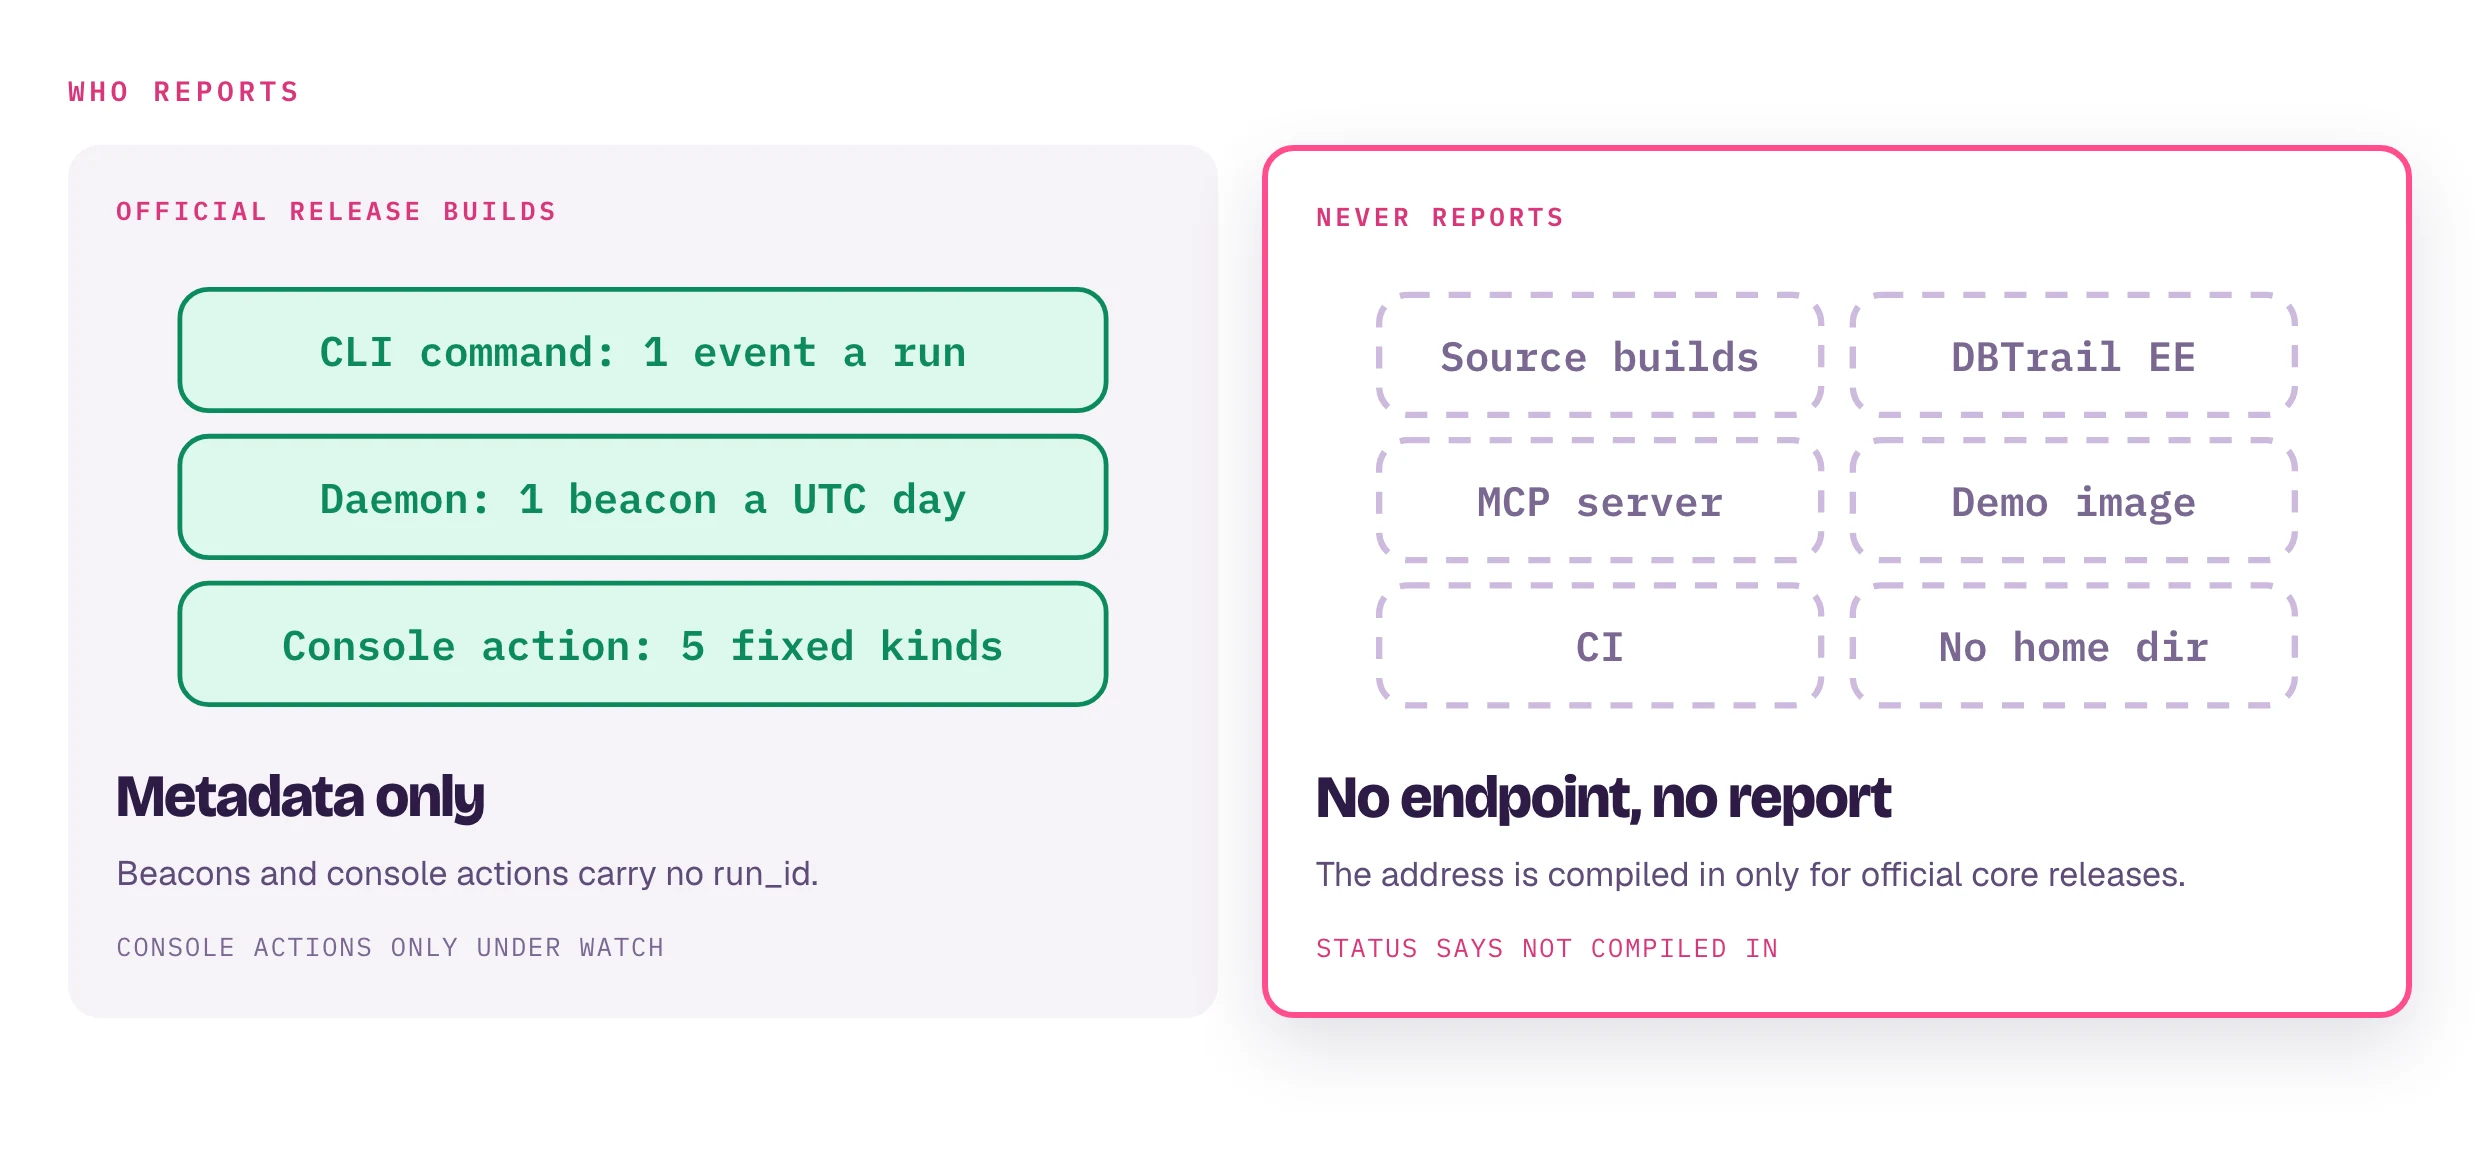
stream,agent,up,watch,bintrail-console serve,bintrail shim,bintrail-pg stream,bintrail-pg flashback): at most one beacon per UTC day, the first after an hour of running. They log oneWARNline at startup when telemetry is on. - Console actions, under
watchonly:console-recover,console-recover-cascade,console-reconstruct,console-verify,console-baseline. Browsing records nothing. No JavaScript beacon. - Cloned images carry the setting. Put
BINTRAIL_TELEMETRY=offorDO_NOT_TRACK=1in the base image.
Not a sales channel: requests carry no account identifier. Full specification and the tests that enforce it: TELEMETRY.md.