Capacity Planning
Resource usage, index sizing, retention, indexing lag, and failure recovery for production dbtrail deployments
dbtrail's capture pipeline is deliberately lightweight: bintrail up runs the replication stream, indexer, and built-in rotation in a single process, and the heavy state lives in the MySQL index database — not in dbtrail itself. Sizing a deployment is mostly about sizing the index database and its disk. This page covers what you need to plan for in production.
Resource usage
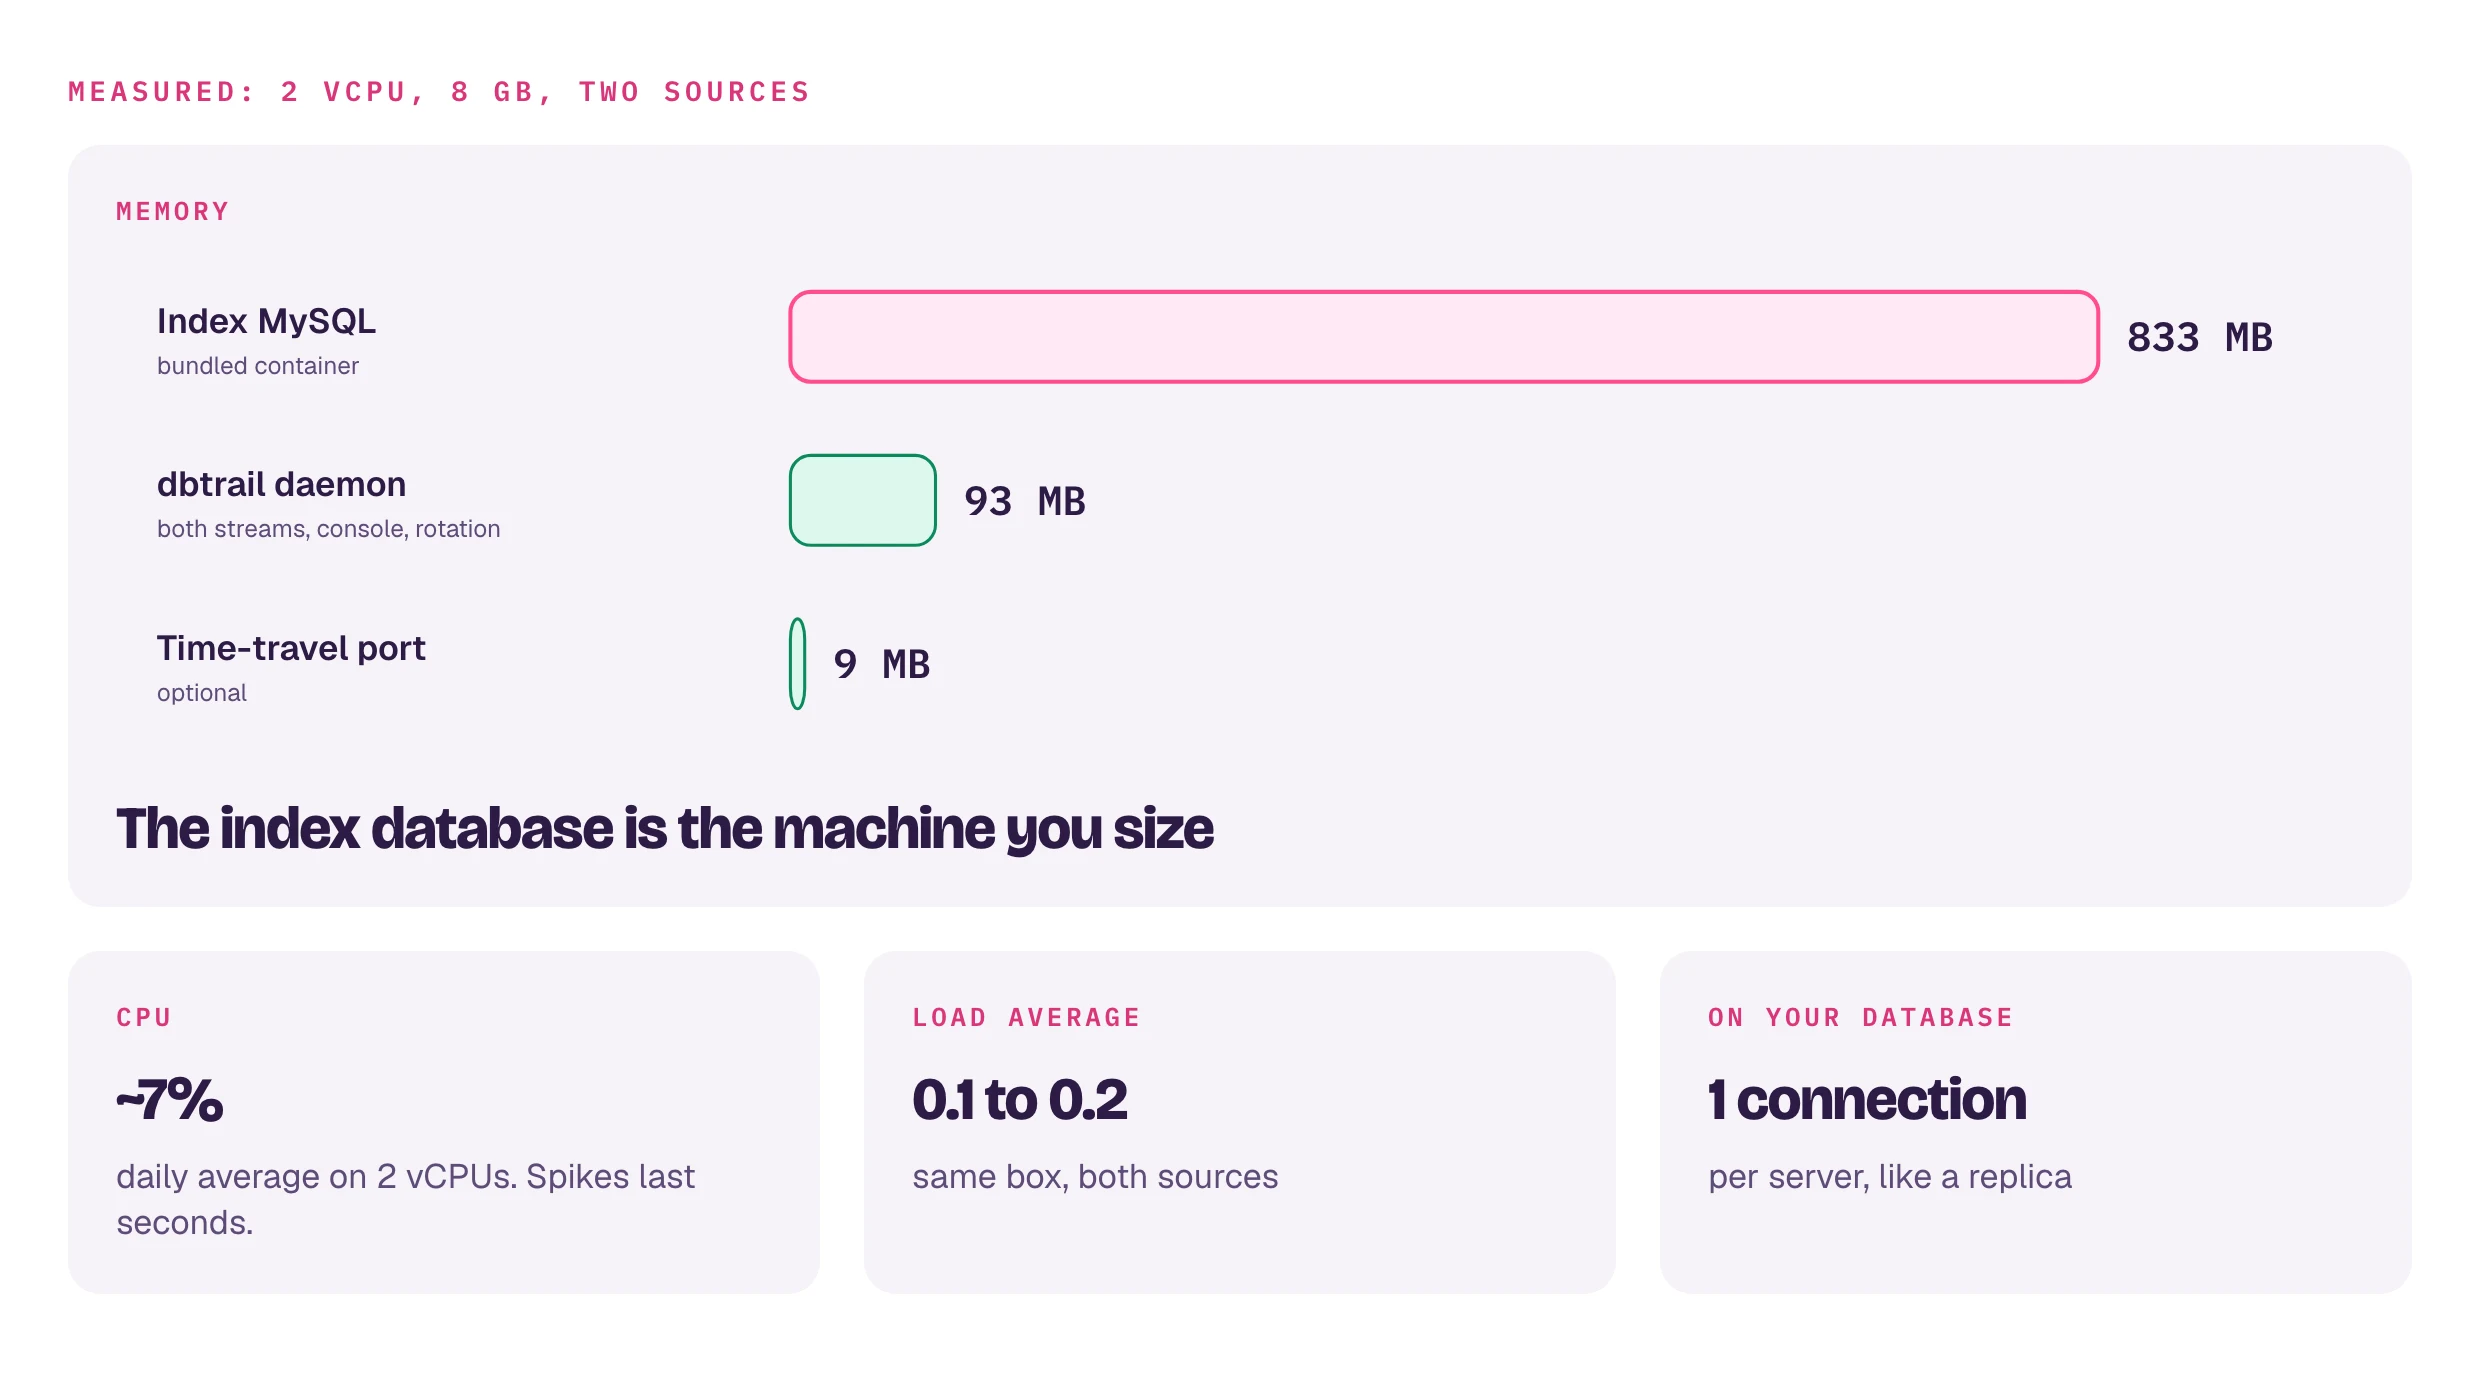
CPU and memory are dominated by the index database (InnoDB buffer pool), not the dbtrail processes.
Real-world measurements
These numbers come from a production deployment on a 2 vCPU / 4 GB RAM host indexing a WordPress database doing ~2,500 writes/day with binlog_row_image=FULL:
| Component | Memory (RSS) |
|---|---|
bintrail stream (binlog parser) | 27 MB |
bintrail rotate (archival daemon) | 30 MB |
| Supervisor daemon (optional) | 14 MB |
| Total dbtrail footprint | ~71 MB |
The remaining ~2 GB of used memory is the InnoDB buffer pool for the index database. The dbtrail processes themselves are lightweight.
CPU: 7–9% average across all hours of the day, with occasional spikes to ~50% during archive rotation (Parquet export + S3 upload). The 51% spike lasts seconds, not minutes. System load average holds steady at 0.1–0.2.
Connections to your source MySQL
Streaming opens a single replication connection to your monitored database (binlog streaming over the replication protocol) — the same footprint as one MySQL replica.
dbtrail Cloud
The Cloud agent opens two additional connections for its connection cache, which polls performance_schema.threads every 500ms to attribute changes to client sessions for forensics. If an active audit log plugin is detected (e.g., Percona Audit Log, MySQL Enterprise Audit), the poller is automatically disabled and the agent drops back to 1 connection, since the audit log provides superior historical connection data.
Index size and disk usage
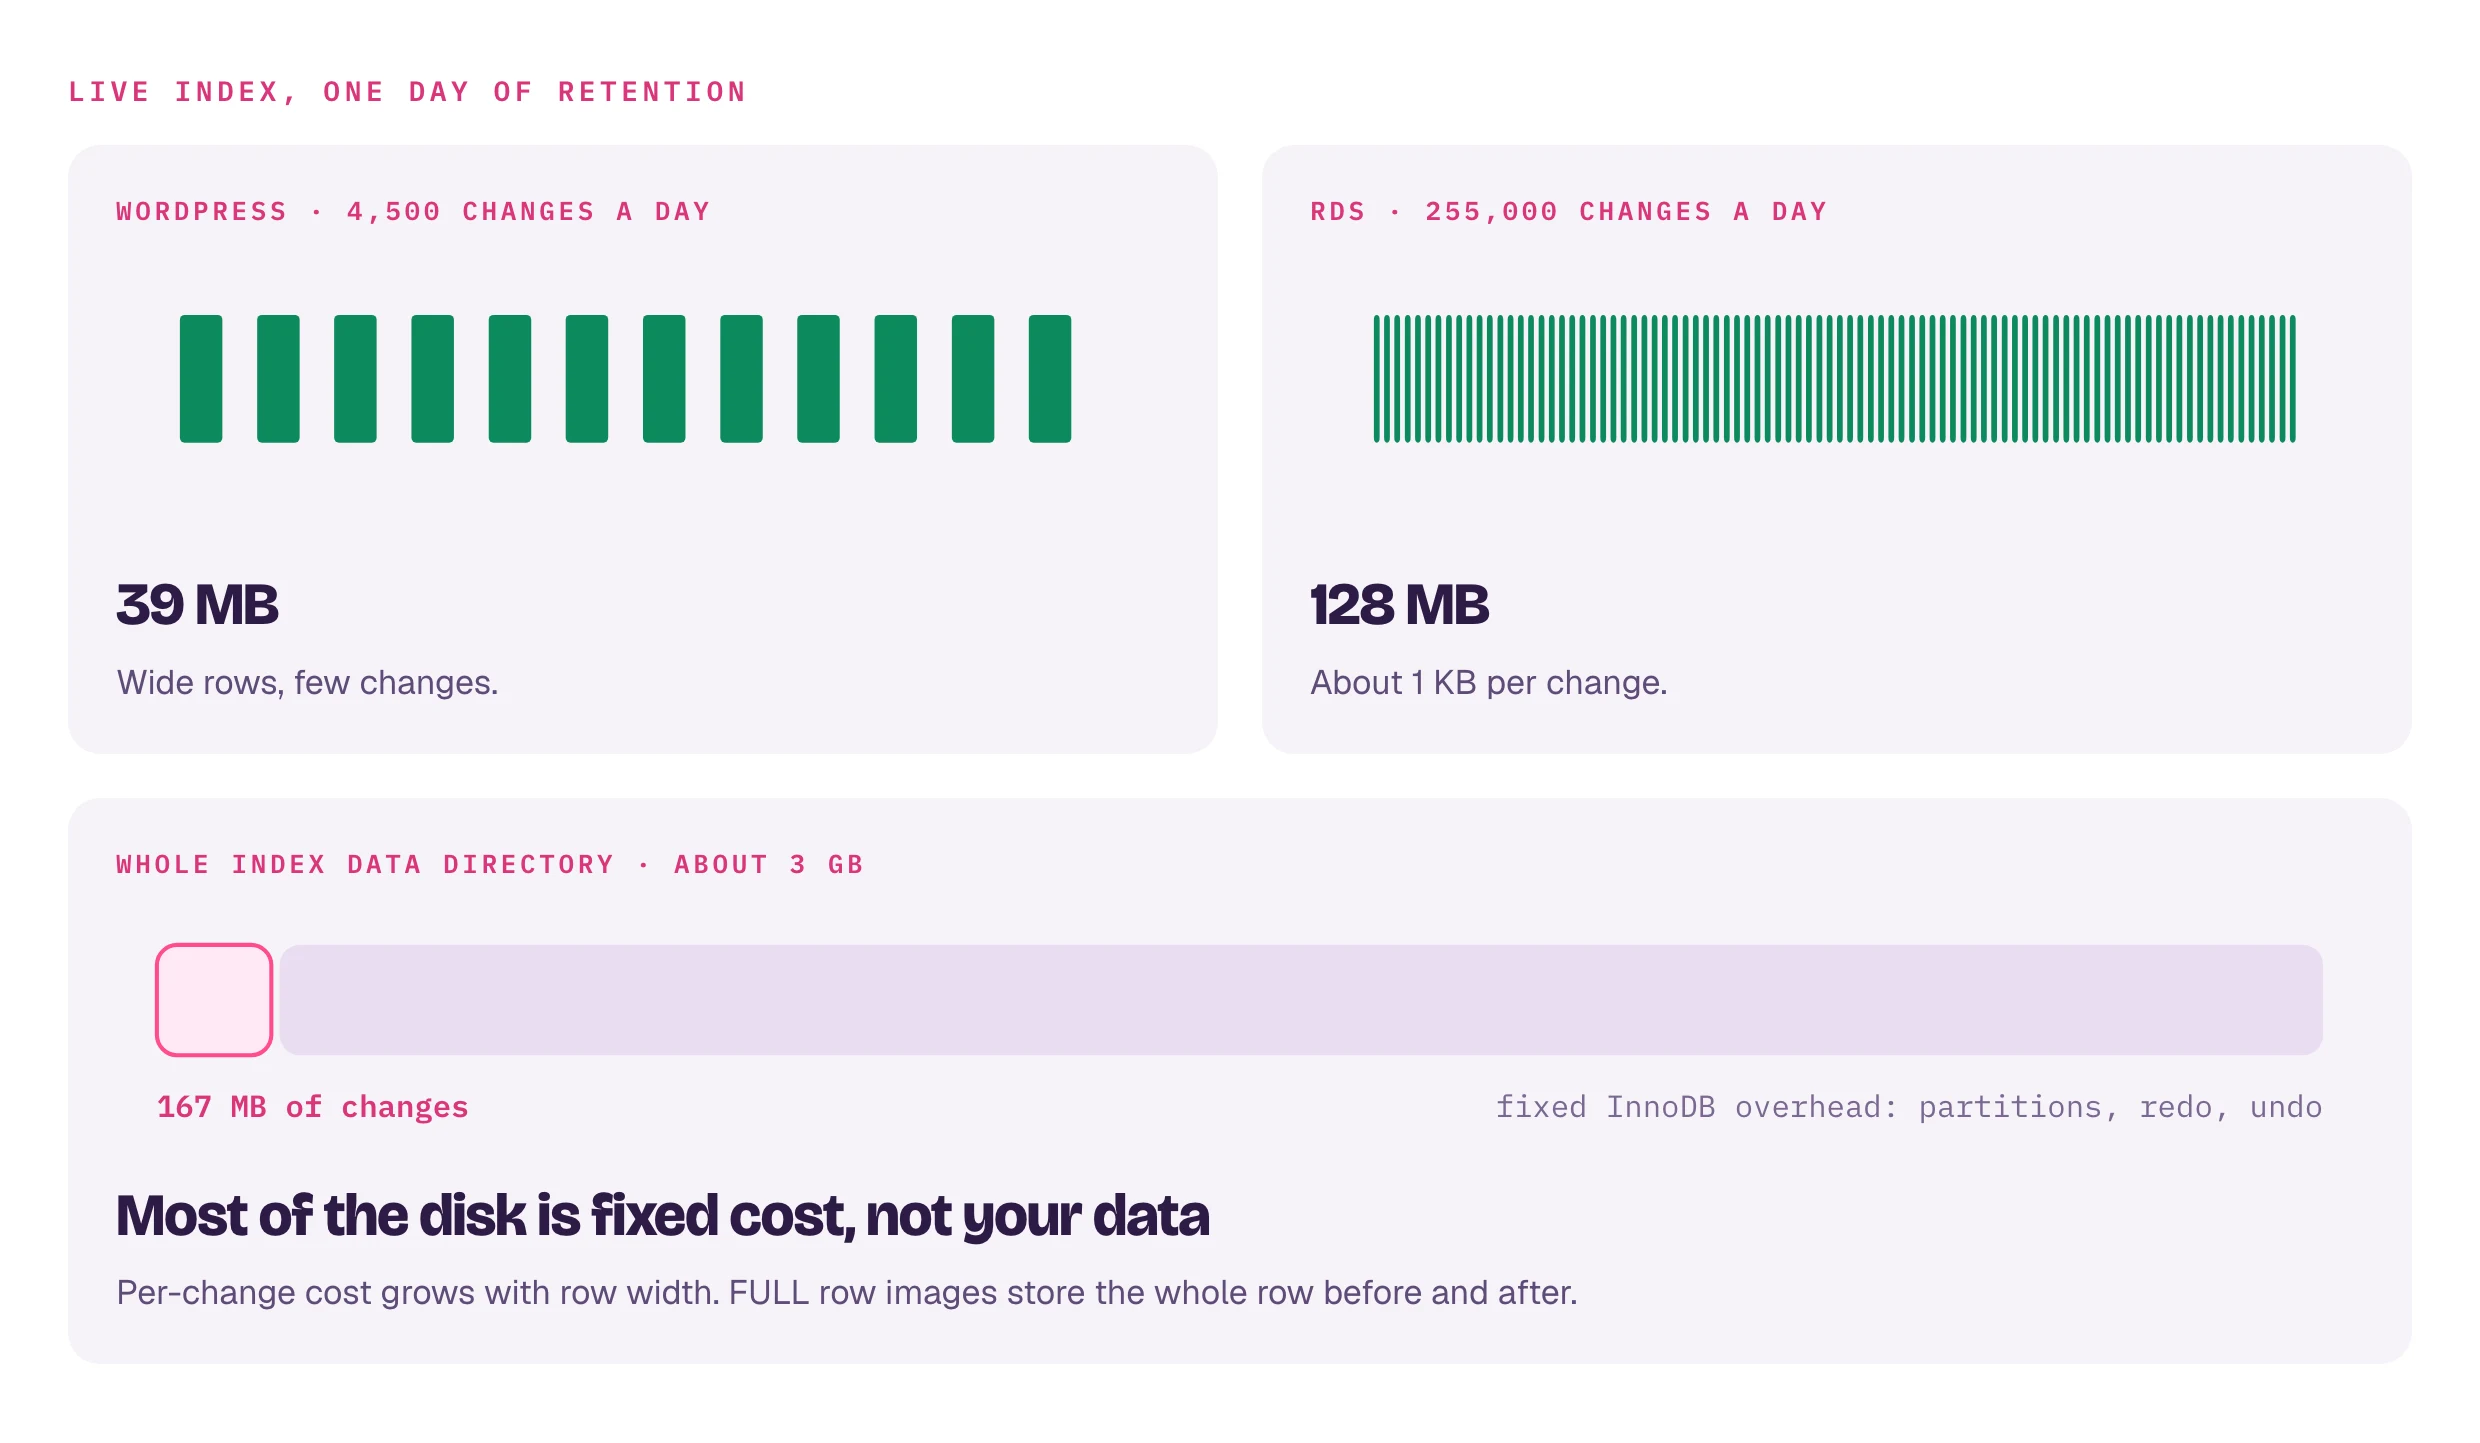
The index database stores one row per binlog change event, including structured before/after column values, timestamps, binlog positions, and schema metadata.
How much disk does the index use?
From the same production deployment (WordPress, ~2,500 writes/day, binlog_row_image=FULL):
| Metric | Value |
|---|---|
| Source binlog throughput | ~40 MB/day |
| Index payload per day | 8–32 MB (varies with write volume) |
| Average event size in index | ~5.5 KB |
| Total events indexed (19 days) | 57,130 |
| Live index size (with 1-day retention) | 107 MB |
| Total disk used (index + MySQL + OS) | 5.5 GB of 50 GB (12%) |
The index-to-binlog ratio depends on your row width and binlog_row_image setting. With FULL row images (which store complete before/after rows), the index is roughly 50–80% the size of the raw binlog. With MINIMAL row images, the index can be significantly smaller since only changed columns are recorded.
Disk monitoring
Run bintrail doctor to check index disk capacity: it measures the index's recent write rate, projects the steady-state footprint over your retention window, and reports an estimate of days until the volume fills when free space is low. A full index volume stalls the stream — and once the source purges its binlogs, that gap becomes permanent.
Sizing recommendation: start a stream, let it run for 24–48 hours, then check disk usage to extrapolate. Schema and table filtering can significantly reduce index size if you only need to track specific tables.
Retention and archiving
Retention is fully under your control. bintrail up runs built-in rotation with --rotate-retain (default 30d) on a --rotate-interval schedule (default 1h). For archival to your own S3 bucket, run the standalone rotate daemon:
bintrail rotate --index-dsn "..." --retain 30d \
--bintrail-id <server-uuid> \
--archive-dir /var/lib/bintrail/archive \
--archive-s3 s3://my-bucket/archives/ \
--daemon --interval 1hHow retention works
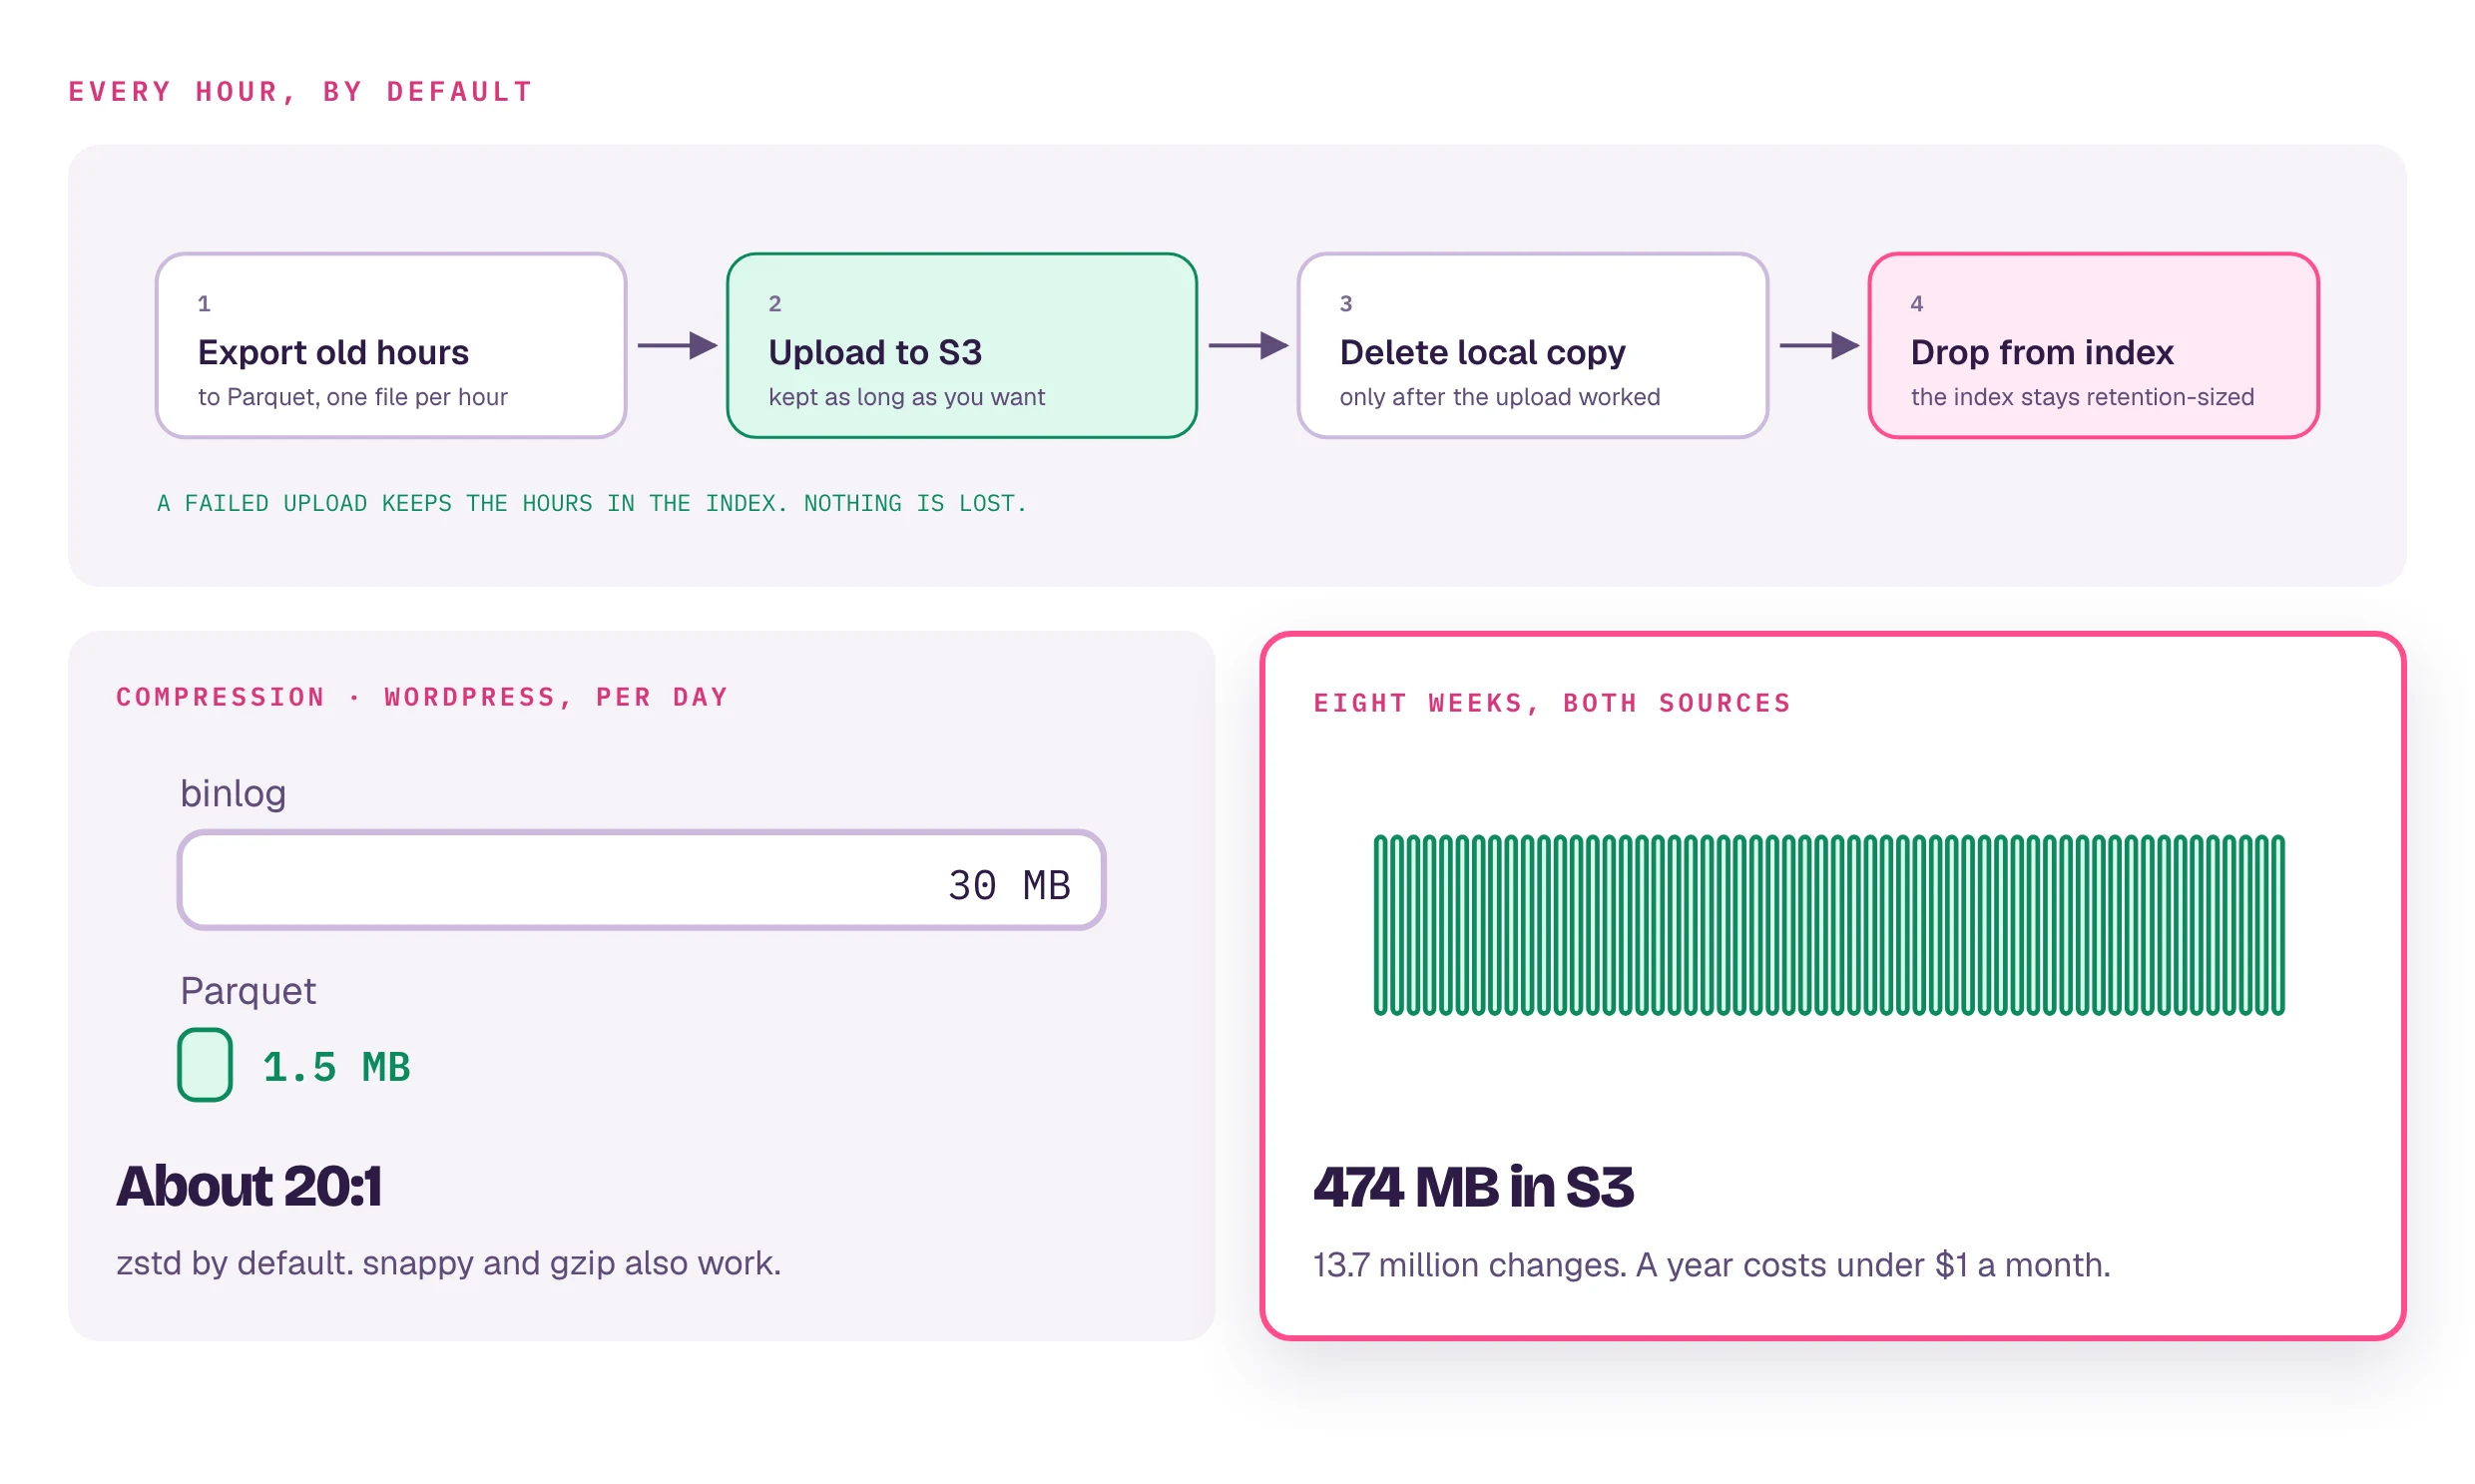
The rotate daemon runs on a configurable interval (default: every hour). It:
- Exports events older than the retention window to Parquet files, partitioned by date and hour
- Uploads Parquet files to S3
- Deletes local Parquet files only after the upload succeeds
- Purges expired rows from the live index
Archive compression
From 19 days of production data:
| Metric | Value |
|---|---|
| Parquet files produced | 450 |
| Total S3 archive size | 12.8 MB |
| Average per day | ~670 KB |
| Compression vs raw binlog | ~60:1 |
Parquet's columnar format with built-in compression makes long-term storage extremely efficient — --archive-compression supports zstd (default), snappy, and gzip. Even with a year of archives from a moderately active server, S3 storage costs are typically under $1/month.
S3 lifecycle policies
Retention applies to the local index database. Archived Parquet files in your S3 bucket follow your own S3 lifecycle policies and are not subject to the rotate daemon's retention window. You can keep archives indefinitely in S3 or move them to Glacier for long-term compliance storage.
Indexing lag
Indexing lag is the delay between when a change occurs on your MySQL server and when it appears in the dbtrail index. It's the sum of binlog replication delay, event parsing time, and index write time.
How lag is exposed
bintrail status --format jsonreports per-streamlast_event_timeandlast_checkpointtimestamps — compare against the current time to measure lag- The web console (
bintrail-console, default127.0.0.1:8090) shows live stream lag per server - With
--metrics-addr :9090, the stream exposes a Prometheus/metricsendpoint including thebintrail_stream_replication_lag_secondsgauge — seconds between now and the timestamp of the last processed binlog event
Checkpoint mechanism
The stream writes a checkpoint (binlog file + position, or GTID set) to the index database at a configurable interval (--checkpoint, default 10 seconds). On restart, the stream resumes from the last checkpoint — no events are reprocessed or lost, as long as the source MySQL hasn't purged the binlog files covering the gap.
What affects lag
- Binlog event volume — high-throughput workloads (bulk INSERTs, batch UPDATEs) produce more events per second, increasing parsing time
- Row width — wide rows with large TEXT or BLOB columns take longer to parse and write to the index
- Network latency — relevant if dbtrail connects to the source MySQL over a network (not localhost) or through an SSH tunnel
- Index DB write performance — SSD-backed storage handles typical workloads easily; extremely write-heavy servers may benefit from faster disks or provisioned IOPS
Under typical OLTP workloads (hundreds to low thousands of writes per second), expect sub-second lag. High-throughput batch operations may temporarily increase lag, which recovers once the burst subsides.
Failure and recovery
What happens on restart?
On startup, each stream reads its last checkpoint from the index database and resumes from that position — no events are duplicated or lost. Run bintrail up under systemd or Docker with a restart policy (e.g., restart: always) so the process comes back automatically.
If the source MySQL has purged the binlog files that cover the gap between the last checkpoint and the current position, a fresh snapshot (full dump) is needed to re-establish a baseline. This is the same recovery model as MySQL replication.
Auto-restart behavior
The combined daemon bintrail-console watch supervises its streams with crash-loop backoff: a stream that errors is restarted with a delay that doubles from 15 seconds up to a 5-minute cap, and the retry counter resets after a sustained healthy run. A running stream that saves no checkpoint and flushes no batch for 5 minutes is reported as stalled; a stream that has been crash-looping continuously for 6 hours is given up on (restart it explicitly, or restart the daemon, to re-arm).
Graceful shutdown
On SIGINT/SIGTERM, dbtrail stops streaming gracefully, saves a final checkpoint, and exits cleanly. Systemd and Docker both send SIGTERM by default on stop/restart operations.
Monitoring
For self-hosted deployments, three built-in surfaces cover monitoring:
bintrail status --format json— point-in-time stream state (events indexed, last event time, last checkpoint, partitions). Cron-friendly for simple alerting.- Web console —
bintrail-console(default127.0.0.1:8090) shows live stream health, lag, and archives, and exposes an unauthenticated liveness probe at/api/healthzfor load balancers and uptime checks. - Prometheus — start the stream with
--metrics-addr :9090to expose/metrics. Key series:bintrail_stream_replication_lag_seconds,bintrail_stream_events_indexed_total,bintrail_stream_errors_total,bintrail_stream_checkpoint_saves_total. Alert on lag sustained above your tolerance (e.g., > 60 seconds) and on a rising error counter. The metrics endpoint has no built-in authentication — bind it to an internal interface.
Run bintrail doctor periodically (or before go-live) for prerequisite and disk-capacity checks, including the days-until-full projection.
Sizing recommendations
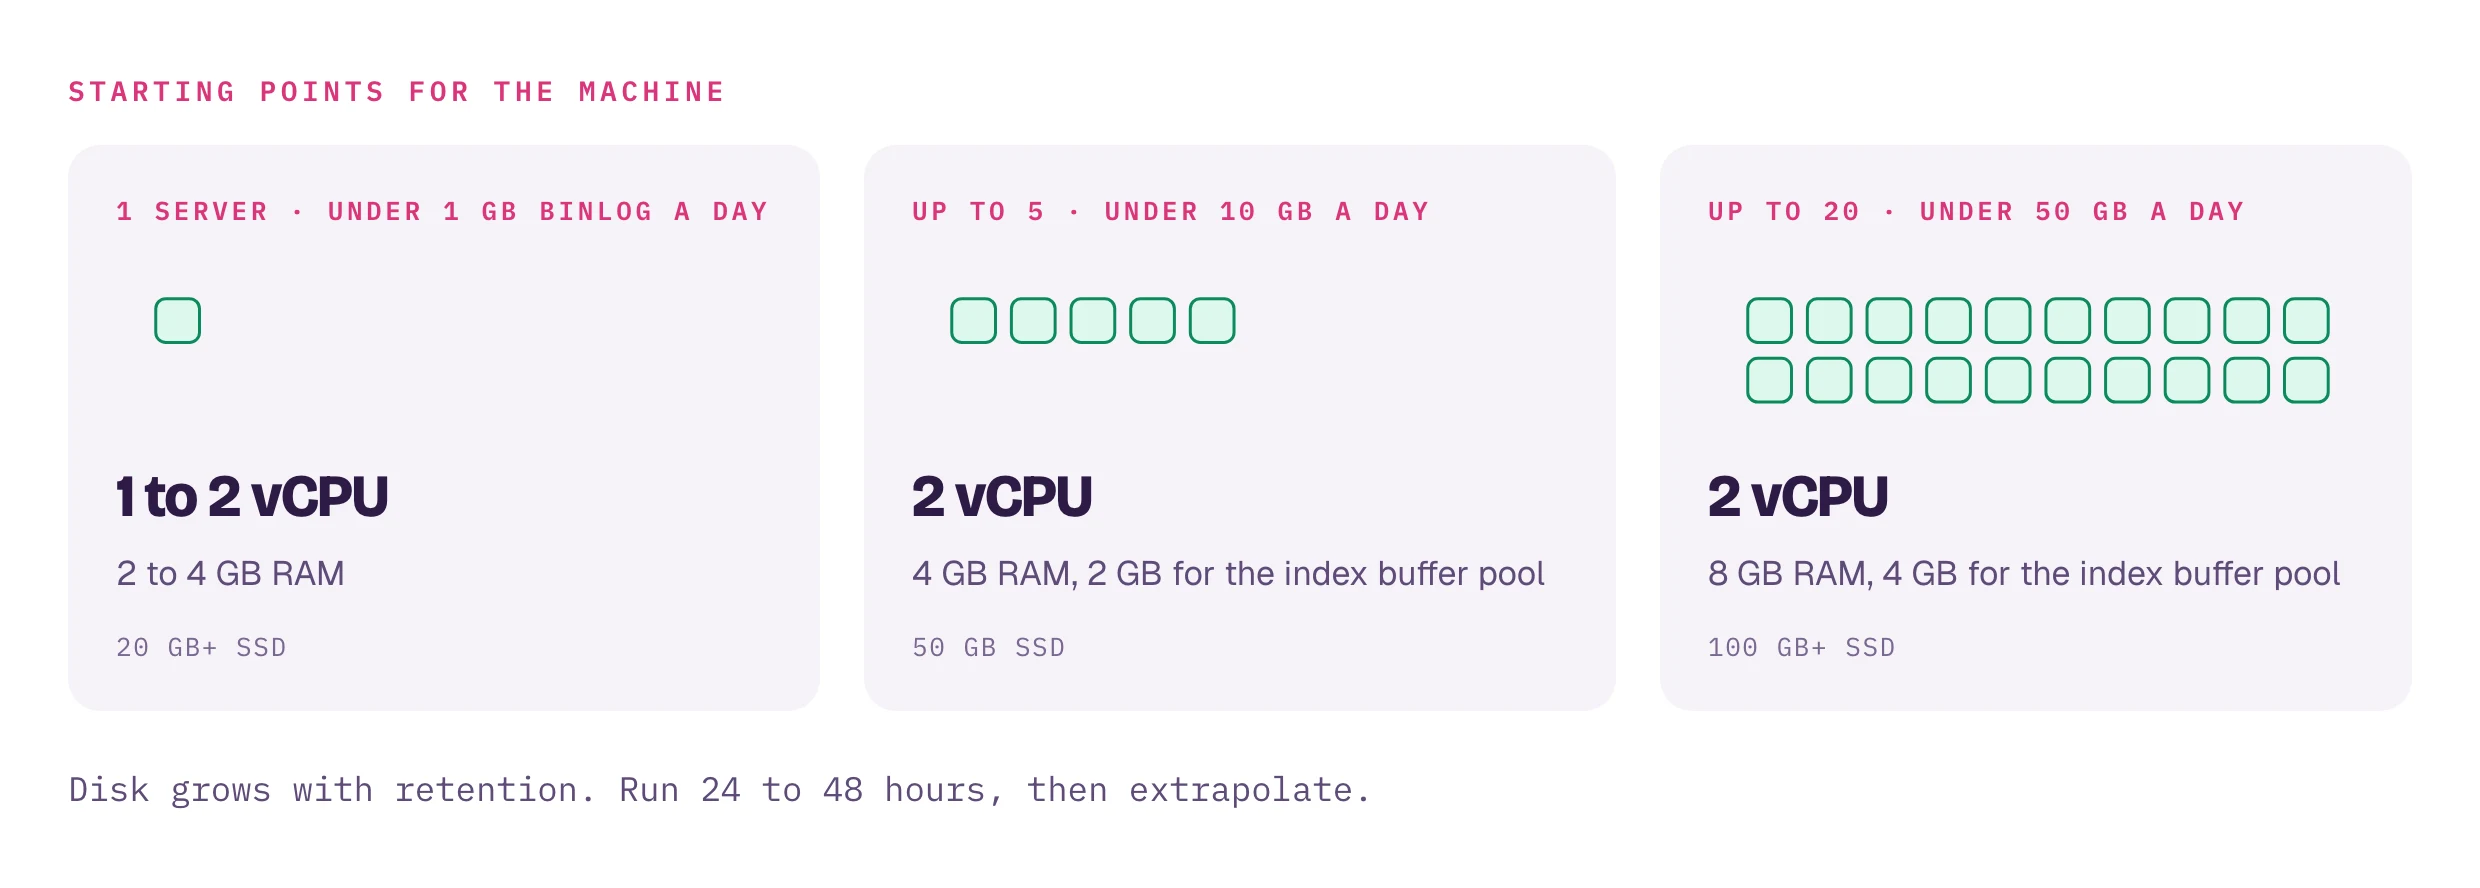
| Workload | Suggested resources | Notes |
|---|---|---|
| Single server, < 1 GB binlog/day | 1–2 vCPU, 2–4 GB RAM, 20+ GB SSD | Plenty of headroom for the measured ~71 MB footprint |
| Up to 5 servers, < 10 GB binlog/day | 2 vCPU, 4 GB RAM, 50 GB SSD | ~2 GB InnoDB buffer pool for the index DB |
| Up to 20 servers, < 50 GB binlog/day | 2 vCPU, 8 GB RAM, 100+ GB SSD | ~4 GB InnoDB buffer pool |
These are starting points. Actual requirements depend on row width, change frequency, and how aggressively you filter schemas and tables — and disk dominates, scaling with retention. Run a stream for 24–48 hours, then extrapolate from real usage with bintrail doctor.
On dbtrail Cloud
On dbtrail Cloud, infrastructure sizing, retention, and monitoring are managed for you:
Instances and plan limits. Free tier runs as a container on a shared instance (CPU/memory not reserved); paid tiers get a dedicated instance with guaranteed resources:
| Free | Pro | Premium | Enterprise | |
|---|---|---|---|---|
| Instance | r7g.medium (shared) | t4g.medium (dedicated) | t4g.large (dedicated) | t4g.large (dedicated) |
| Servers / concurrent streams | 1 / 1 | 5 / 5 | 20 / 20 | Unlimited / 100 |
| History retention | 7 days | 30 days | 90 days | 365 days |
| S3 archive | Not available | Included | Included | Included |
| API rate limit (tenant / per user) | 120 / 60 RPM | 600 / 200 RPM | 2,000 / 600 RPM | 10,000 / 2,000 RPM |
Rate limits apply to API calls (query, recover, status, forensics) — they never throttle the binlog stream itself. Retention is enforced per plan, and managed archives are verified with size and SHA-256 checksums before local cleanup.
Managed monitoring. Each Cloud agent exposes an unauthenticated GET /health (reports disk_usage_percent, disk_free_gb, agent_version; degrades above 95% disk usage, with a separate disk watcher that pauses backup/dump work below 3 GB or 10% free) and an authenticated GET /api/v1/status with per-stream lag and checkpoint detail — see the Status API. Recommended alerts: status != healthy, disk above 80%/90%, and lag sustained over your tolerance.
Auto-restart. The Cloud agent's process manager restarts a crashed stream up to 5 consecutive times with exponential backoff (5 s doubling to 80 s); a stream that stays up 2+ minutes resets the counter, and after 5 consecutive failures the stream is reported as failed.
Choosing a plan. Map the sizing table above to plans: < 1 GB binlog/day fits Free, < 10 GB/day fits Pro, < 50 GB/day fits Premium, and 20+ servers or compliance-driven retention calls for Enterprise. Start with a trial and monitor disk usage for 48 hours before committing — see Server Configuration to get streams running.
Next steps
- Stream configuration — configure binlog streaming, filtering, and checkpoints
- Backup strategy — how dbtrail's backup system works (mydumper snapshots + continuous binlog streaming)
- Troubleshooting — common issues and resolution steps
- Status API — dbtrail Cloud endpoint details for monitoring integration