dbtrail
dbtrail EE

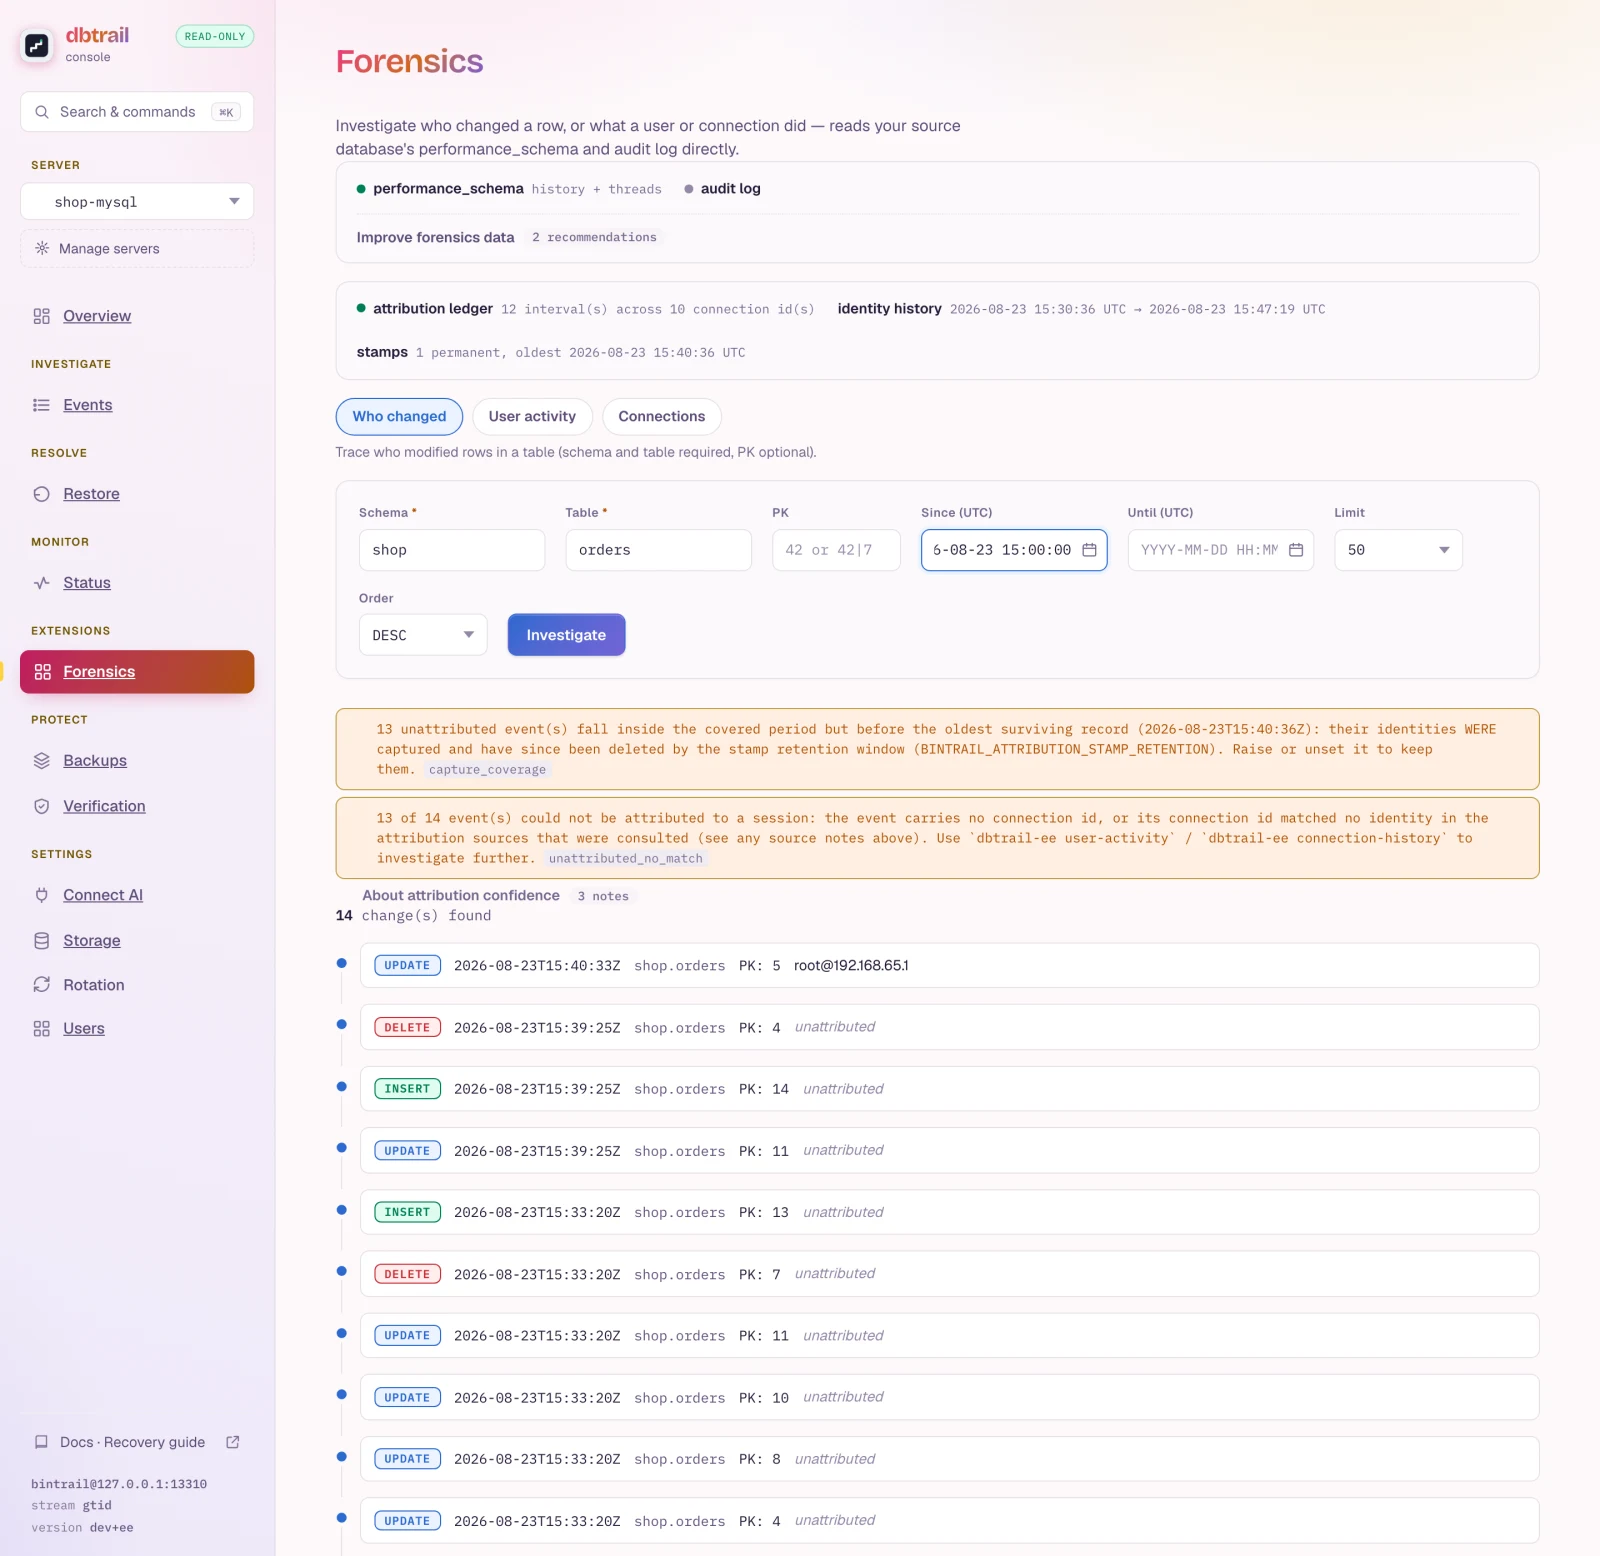
Forensics

Who changed this row. Attribution tiers, confidence labels, audit-plugin setup, and the honest limits of MySQL-side evidence

Enterprise feature

The forensics surface ships in dbtrail-ee and activates only when your license carries the forensics feature (dbtrail-ee license shows your feature list). Without it the commands below simply do not exist in the binary. The underlying capture (the connection_id, query_text, and query_hash columns in the index) is part of the open-source core and is always recorded; what is licensed here is the attribution surface that turns those columns into names.

dbtrail's index always tells you what changed: every row, with its full before and after images. Forensics answers the next question: who did it. Which database user, from which host, with which client program. And when the source is configured for it, the exact SQL statement.

$ dbtrail-ee who-changed --index-dsn "$IDX" --source-dsn "$SRC" \
    --schema shop --table orders --pk 42

Each matching change comes back with a name attached, or an honest "unknown", together with the reason and the queries you could run yourself. dbtrail never guesses silently: every answer is labeled with where it came from and how much you can trust it.

The one fact that explains everything on this page

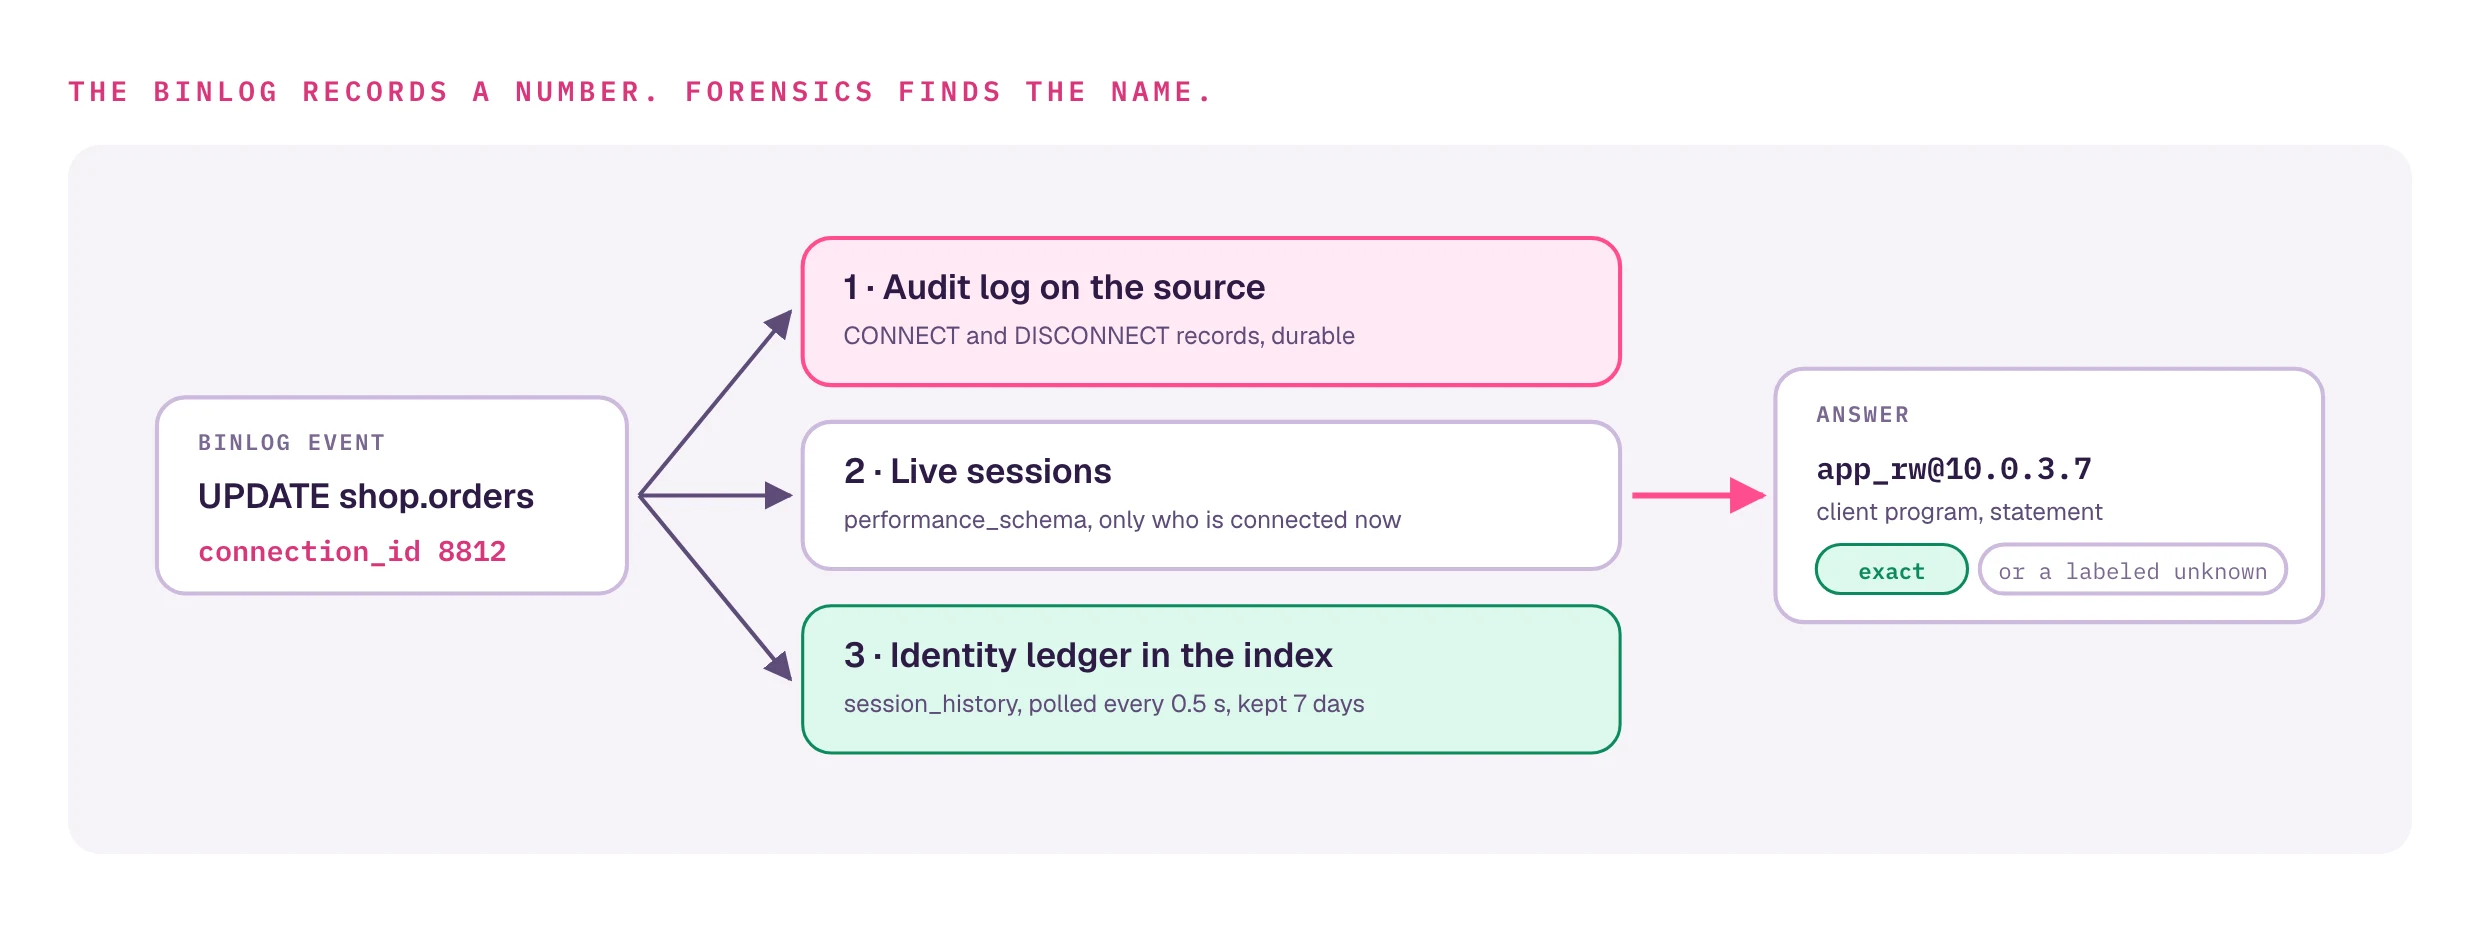
The binlog records a connection number, not a name. MySQL writes which connection made each change (connection_id), but not who was behind it. Everything forensics does is turn that number back into a name, using the best evidence available at the moment you ask. How good that evidence is depends almost entirely on one choice: whether an audit plugin is writing a log on your source server.

What to expect, with and without an audit plugin
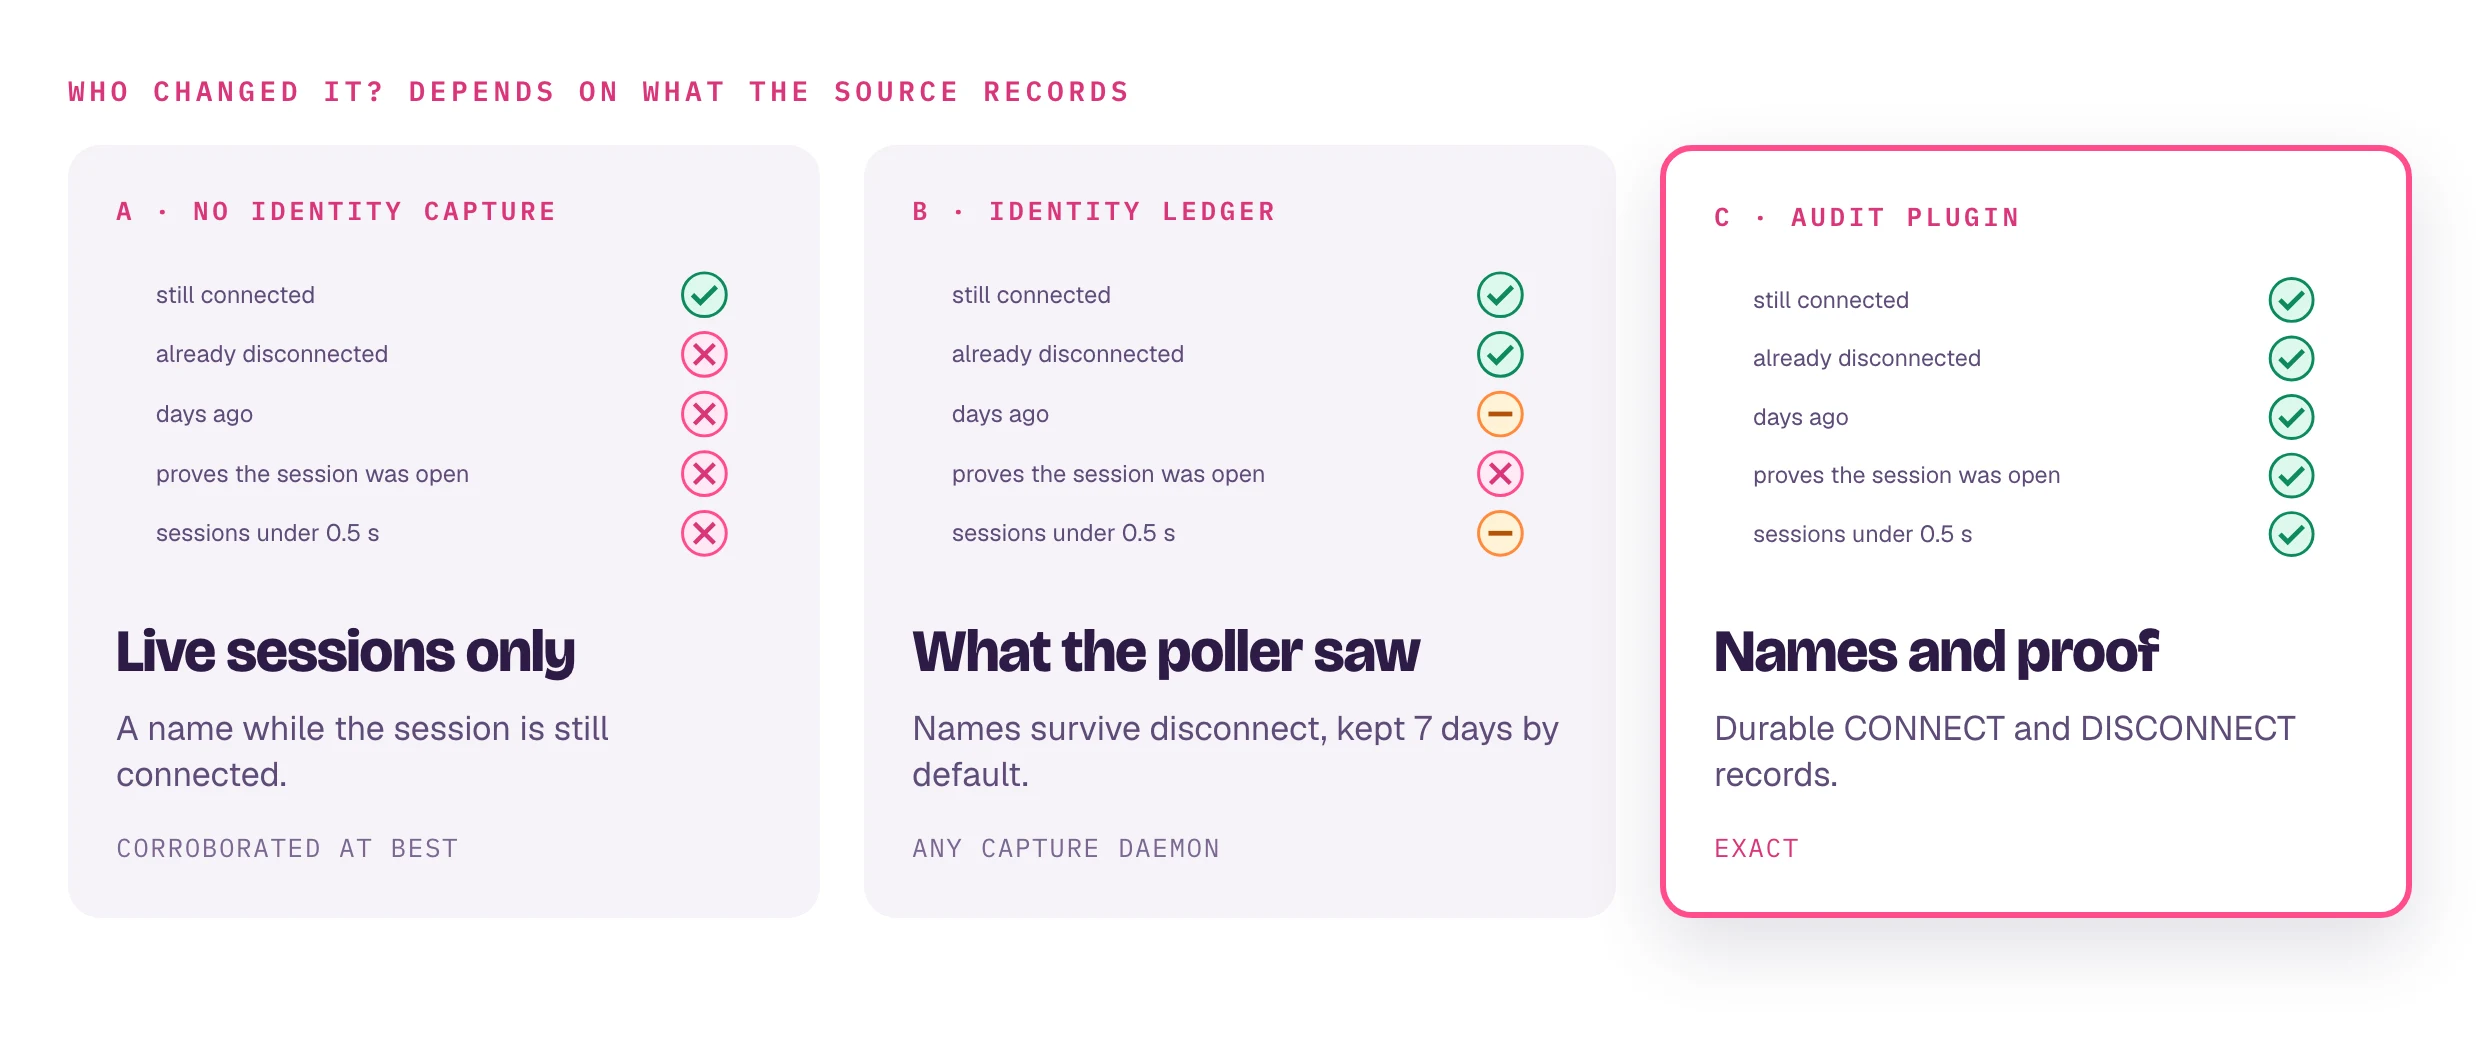
Three realistic setups:

  • A: no identity capture. You run a capture daemon with the forensics feature unlicensed (or BINTRAIL_ATTRIBUTION_RETENTION=0), no audit plugin.
  • B: capture + identity cache. You run any capture daemon: dbtrail-ee up, stream or agent, plus the dbtrail-console-ee web console's watch and control-plane monitor daemons. It also polls the source's live session list twice a second and saves what it sees into the index, so a name can outlive its session.
  • C: audit plugin installed. Any supported audit plugin writes a log on the source (see below).
QuestionA: plainB: + identity cacheC: + audit plugin
Who changed this row, if the session is still connected?✅ name (corroborated)✅ name (corroborated)✅ name (exact)
Who changed it, if the session already disconnected?❌ unknown✅ usually, if the poller saw the session while it lived (corroborated)✅ name (exact)
Who changed it, days ago / while nothing was running?❌ beyond the ledger retention (default 24 h)✅ within the audit log's retention. With the daemon running, also within the ledger's retention even after the log rotates (the ingester persists each session's lifetime)
Can dbtrail prove that session was open at that moment?✅ the log's CONNECT/DISCONNECT records bracket each session
Very short sessions (connect → write → disconnect in under 0.5 s)?⚠️ can slip between two polls
Which SQL statement made the change?✅ if binlog_rows_query_log_events=ON (independent of all of this, see below)samesame, plus the audit log's own copy

The honest summary: without an audit plugin, dbtrail can only name sessions it (or MySQL) was watching at the right moment. With one, it can name sessions after the fact and prove the match. If "who did this?" matters to you operationally, install the audit plugin. dbtrail-ee doctor tells you exactly how for your server flavor.

How to read the confidence labels

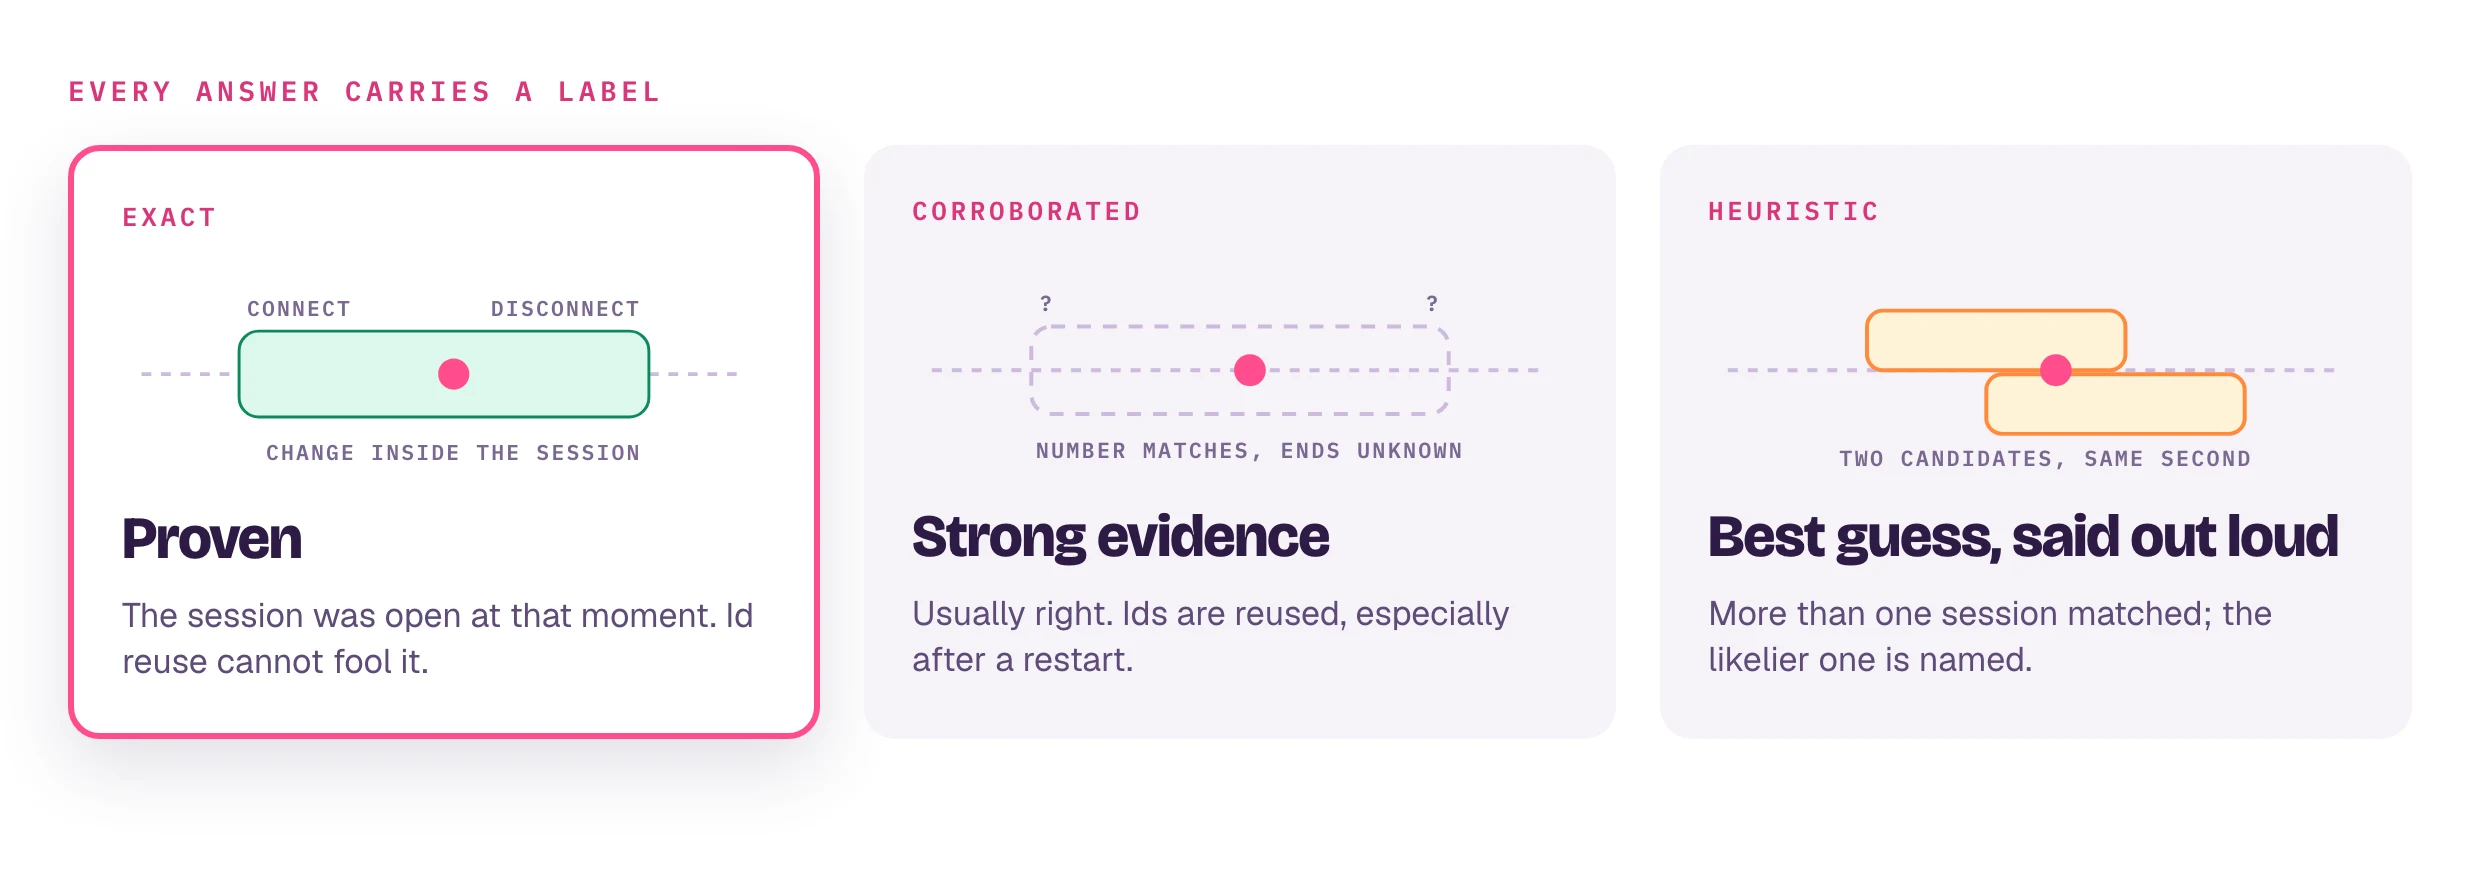
Every attribution carries a label. In plain terms:

  • exact means dbtrail can prove it: the audit log shows that connection belonged to this user and was open when the change happened. Id-number reuse cannot fool this.
  • corroborated means the name matches the connection number, but dbtrail cannot prove that session was open at the event's moment. Usually right; connection numbers are reused (especially after a server restart), so treat it as strong evidence, not proof.
  • heuristic means more than one candidate matched (for example, two sessions on the same number within the same second) and dbtrail picked the most likely one. It says so instead of pretending certainty.

Answers also carry notes: plain-language caveats that apply to your result (a truncated audit read, an unreachable source, a coverage gap). They are part of the answer, not log noise: if a note says a source was NOT consulted, don't read the result as "that source had nothing".

Without an audit plugin: what performance_schema can and cannot do
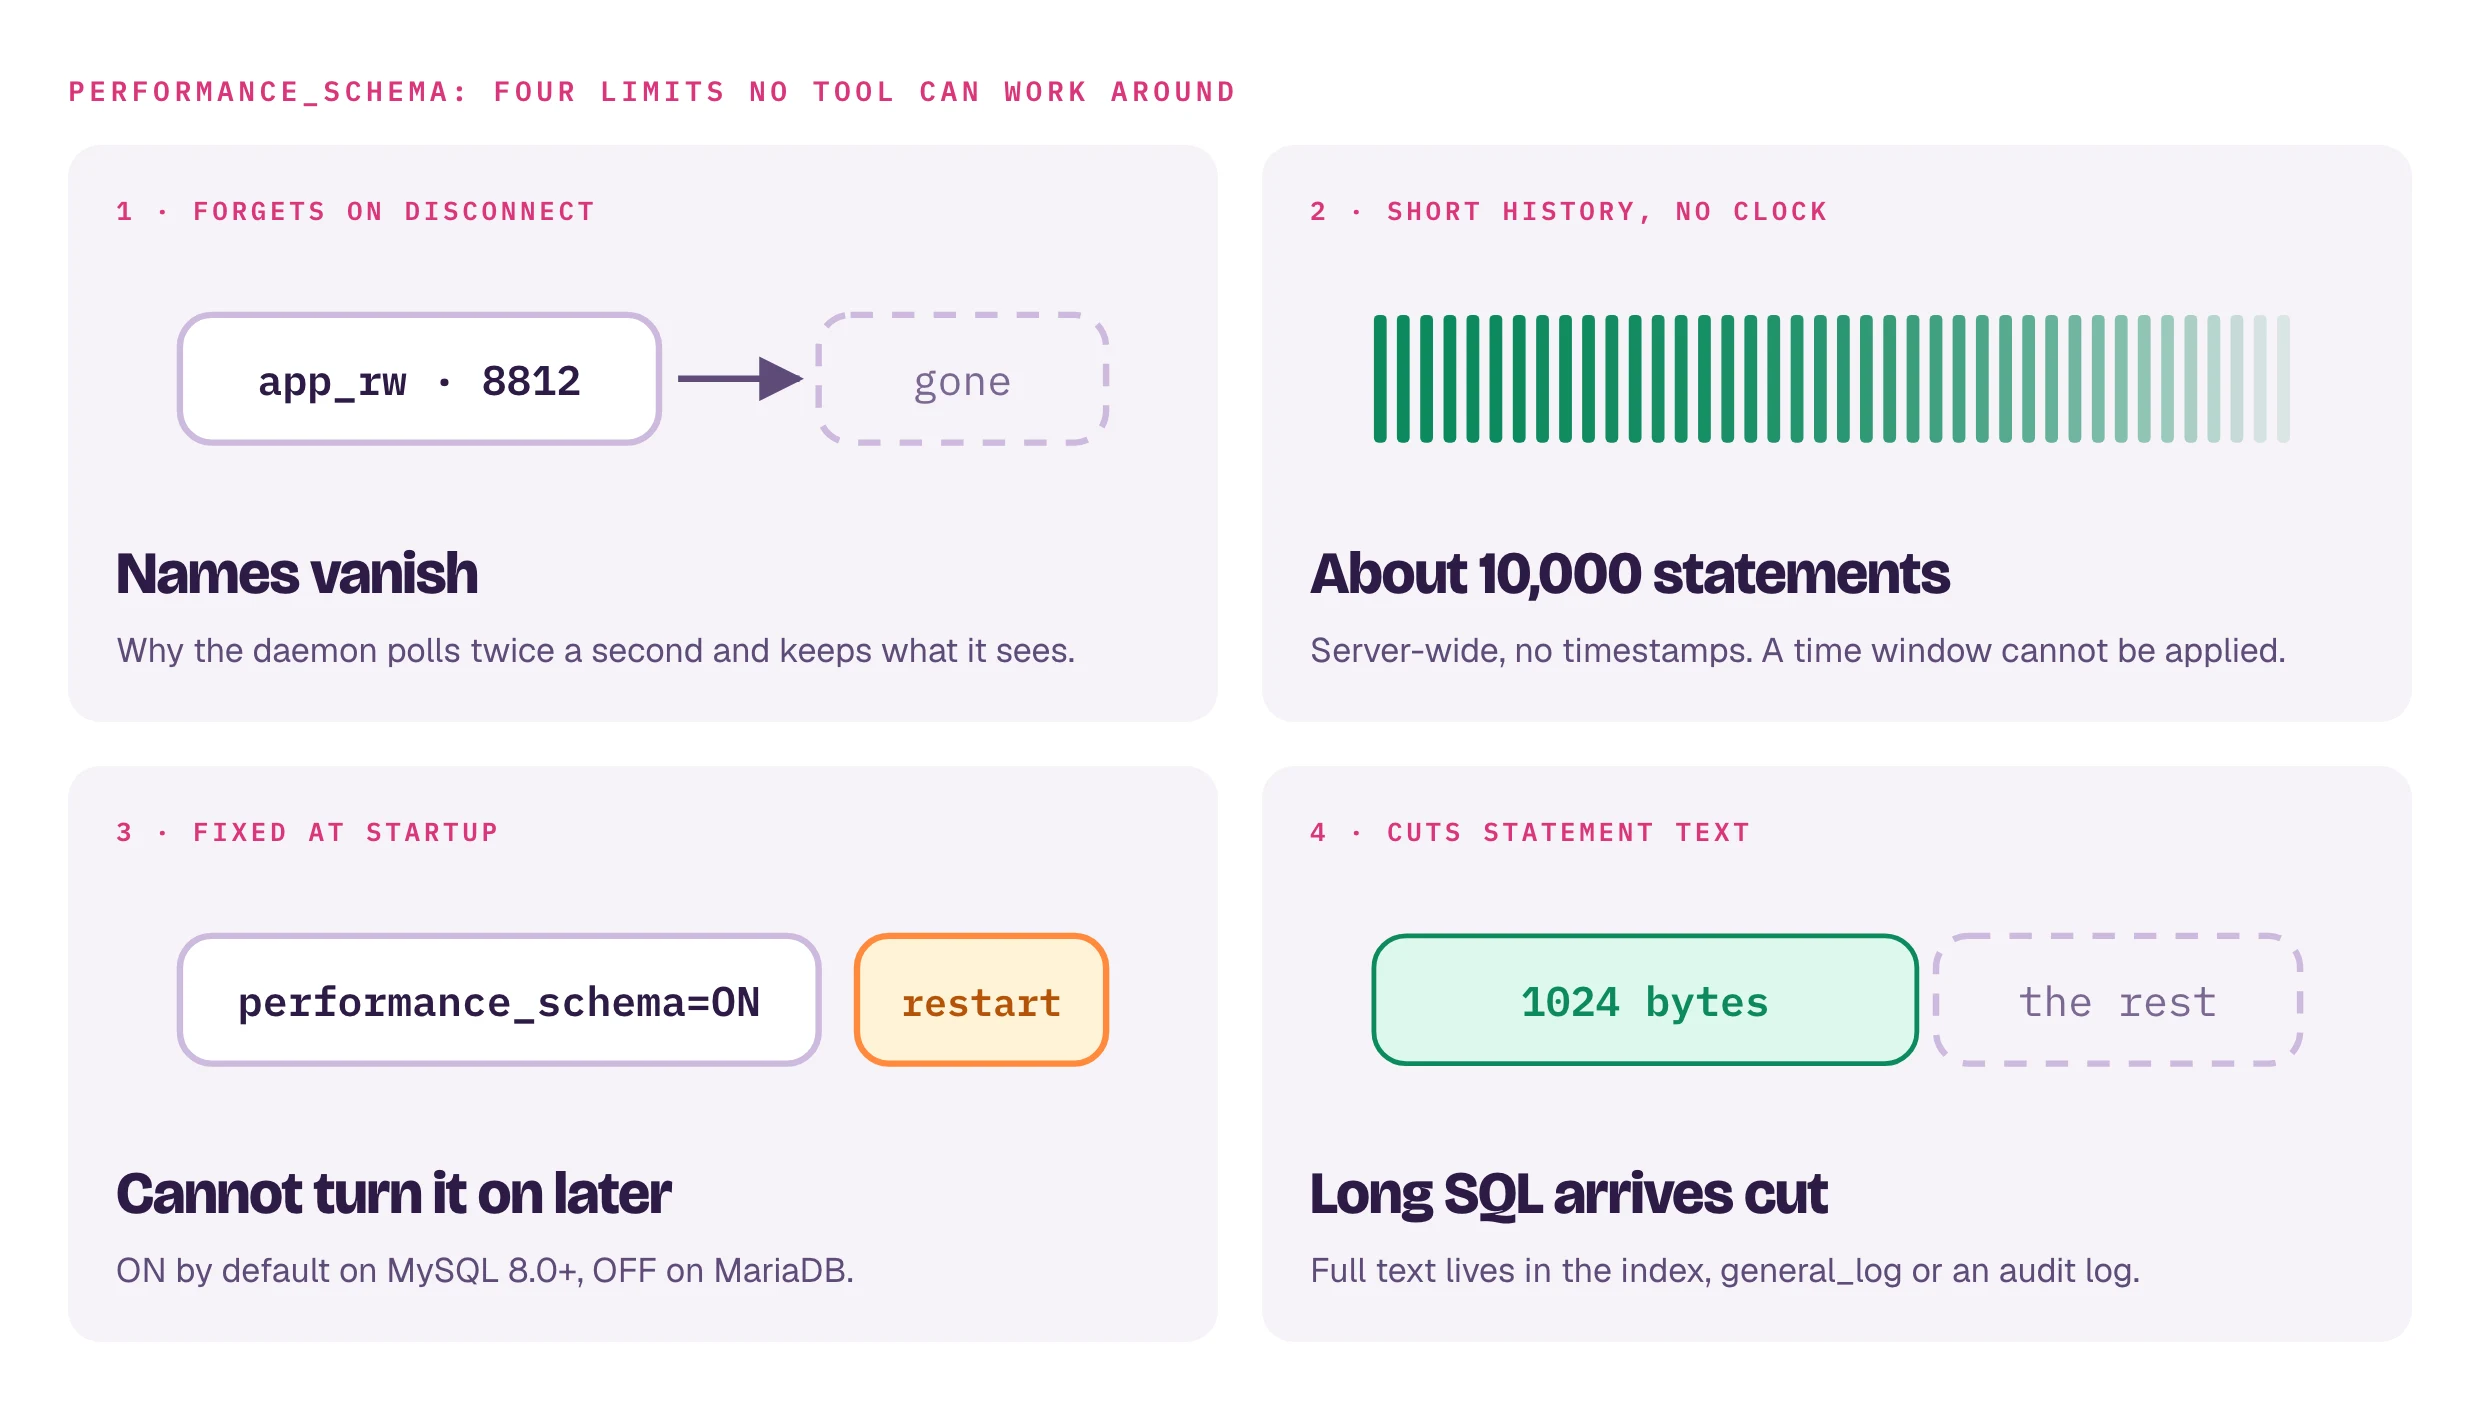
performance_schema is MySQL's built-in live view of the server. It is the best free evidence source, and it has four hard limits that no tool can work around. They shape everything in column A/B above:

  1. It forgets a session the instant it disconnects. The user, host, and client program of a disconnected session are simply gone. That is why the up daemon polls it twice a second and saves what it sees (the identity cache, kept for BINTRAIL_ATTRIBUTION_RETENTION, default 24 h): so a name survives its session. A session shorter than the gap between two polls can still be missed.

  2. Its statement history is a short ring buffer with no clock. By default the server keeps roughly the last 10,000 statements server-wide, and the entries carry no wall-clock timestamps. On a busy server that is seconds to minutes of history, and you cannot filter it by time of day. This is why dbtrail-ee user-activity shows whatever the buffer still holds, not necessarily the latest statements: --order ASC returns the oldest retained ones, and a server with statement timing off has no usable sort key at all. It cannot honor "between 14:00 and 15:00" on the live path, which is why the durable what-happened answers always come from dbtrail's own index instead. It is not silent about it: pass --since/--until and the answer carries a note saying the filter was not applied, so an unfiltered result is never mistaken for a filtered one. dbtrail attaches the note whatever the answer looks like: with results, with no results, and when the read itself failed. An empty user-activity for a window you supplied is the result most easily misread as "nothing happened then", and it is the one that says loudest that the window was never applied.

    The same disclosure covers connection-history, where the gap is wider still: that answer comes from the sessions connected right now, so a time window cannot be honored at all. (The connection-history command takes no --since/--until flags today; the window only reaches that query from the console and the agent, which do accept one.) An empty connection-history says so too: performance_schema.threads forgets a session the instant it disconnects, so "no rows" is not "this account never connected", and the answer ships with the cumulative performance_schema.accounts query that does survive disconnection.

  3. It cannot be switched on after the fact. performance_schema=ON/OFF is fixed at server startup (on RDS/Aurora: parameter group + reboot). It is ON by default on MySQL 8.0+, but OFF by default on MariaDB.

  4. It truncates the statement text it does keep. SQL_TEXT is cut at performance_schema_max_sql_text_length bytes: 1024 by default, and fixed at server startup like the switch above. A wide multi-row INSERT or a long UPDATE ... WHERE id IN (...) therefore arrives cut off, and nothing in the result set announces it. dbtrail-ee user-activity compares every returned statement against the server's own ceiling and adds a note when any of them is at or near it. The full text of a cut statement has to come from a durable record: dbtrail's own index first (query_text, captured with a 16 KiB cap, sixteen times the performance_schema ceiling, when binlog_rows_query_log_events / binlog_annotate_row_events is ON at the source; dbtrail-ee who-changed shows it), then mysql.general_log, then an audit log. Raising the performance_schema ceiling needs a restart and only affects statements captured afterwards. It cannot un-truncate history.

    connection-history cuts at a different, lower, non-configurable limit. Its current_query column comes from performance_schema.threads.PROCESSLIST_INFO, which is capped at a fixed 1024 bytes regardless of performance_schema_max_sql_text_length and appends nothing to mark the cut. Measured on MySQL 8.0.46 started with --performance-schema-max-sql-text-length=4096: a live 3025-byte statement came back as 1024 bytes of PROCESSLIST_INFO while SQL_TEXT held all 3025. dbtrail-ee connection-history now says so when a returned current_query is at or near that limit. The uncapped copy is information_schema.PROCESSLIST.INFO, but reading other accounts' rows there needs the PROCESS privilege (an account with only SELECT on performance_schema sees just its own session), which is why the generated fallback SQL carries that warning too.

    "At or near" is literal. Only a pure-ASCII statement is stored at exactly the ceiling: the server backs the cut off to a whole character first, so a statement containing accented, CJK or emoji text lands a few bytes short (measured on MySQL 8.0.46: as low as 1012 bytes against a 1024 ceiling). MySQL 8.0 marks what it cut by appending ... inside the stored text, and the note uses that marker to catch the below-ceiling cases. A flavour that truncates without a marker (MariaDB is unverified here; PROCESSLIST_INFO demonstrably does not write one) is still caught at or above the ceiling, but a below-ceiling multi-byte cut there can go unreported. When the exact statement text matters, performance_schema is never the source of truth: dbtrail's own index or an audit log is.

dbtrail's role here is deliberately modest: it reads performance_schema (read-only, never changes your server), caches identities while it runs, and tells you honestly when the evidence ran out.

With an audit plugin: the full answer

An audit plugin writes every connection (and optionally every statement) to a log file on the source. That file is what performance_schema can never be: a durable record. With it, dbtrail:

  • names sessions long after they disconnected;
  • brackets each connection number with its CONNECT..DISCONNECT records, so dbtrail attributes an event only to an identity whose session actually contained it, which is what earns the exact label and defeats id-number reuse;
  • keeps working across dbtrail restarts (the evidence lives on your server, not in dbtrail's memory).

Supported families:

ServerPluginNotes
Percona Serveraudit_logfree; JSON, CSV and both XML layouts (OLD, the plugin default, and NEW) are read. The newer audit_log_filter plugin is read too: its JSON log and its XML output
MariaDBserver_auditfree; also the dialect used by RDS MySQL/MariaDB
RDS / Aurora MySQLMariaDB Audit Plugin (via option group / advanced auditing)dbtrail reads the logs through the AWS API. Needs rds:DescribeDBLogFiles + rds:DownloadDBLogFilePortion on the host's IAM role. (A CloudWatch Logs reader exists in the library, selectable via the agent's forensics_audit_log command with source: "cloudwatch"; who-changed does not use it today.)
MySQL Communitynone built inMySQL Enterprise Audit exists (commercial); Percona Server is a free drop-in alternative

Run dbtrail-ee doctor --source-dsn "$SRC". It detects what you have and prints copy-pasteable setup SQL / my.cnf snippets per flavor. dbtrail only ever reads: it never installs plugins or changes settings on your server.

Two honest caveats:

  • Retention is yours to manage. dbtrail can never attribute an event whose audit records were already rotated away or pruned. On RDS/Aurora instance storage that can be a matter of hours. If you need long forensic reach, size the audit log's rotation accordingly (or export to CloudWatch with an explicit retention).

  • A read that understood nothing says so. dbtrail parses every on-disk format shipped today, and fixtures cover each one: MariaDB/RDS/Aurora/CloudWatch, Percona audit_log (JSON, CSV, OLD and NEW XML), Percona audit_log_filter, MySQL Enterprise. Where a file's record shape or timestamp layout is still one dbtrail does not recognise, the read reports the dropped records and warns; it never returns an empty result that reads as "nothing happened". That includes a file whose bytes yielded no record at all (a plugin format switch leaves the old filename in place) and a CloudWatch read whose logs:DescribeLogGroups probe is denied. The retention floor is then reported as unknown, with the missing IAM action named, rather than disappearing. The same applies to reach: a window that starts before the oldest record a read could reach is flagged in every regime, and the warning says which regime it is: "this read opened every file in scope and read each one in full, and saw nothing older than X" (an observation, not a claim that the earlier records were pruned: an audit plugin enabled after the window starts produces the same shape), "a file in scope could not be read end to end", "this read did not open the rotated files; retry with include_rotated", "tail mode read only the last N of <file>; use tail_lines=-1 for a full scan", or "this read filled its record cap at N events and stopped before the rest of the window". Tail mode is the default whenever since is set without an explicit tail_lines, so that case is a common one; it, and the record cap, now state what the read covered rather than going silent.

    Both halves of that (the claim and the remedy) come from what the reader actually did, not from the row count: which reader ran (local files, classic RDS, the Aurora striped set, CloudWatch), why its reach ended (natural end, the file-loop record cap, a per-file scan cap, a tail seek, a scope limit, or the time-bounded API query), and what it covered (which files were opened, whether the rotation chain was walked to its end, whether a file was left partly read). Three consequences worth stating:

    • A remedy is only offered by a reader that honours it. include_rotated widens the local-file and classic-RDS rotation chains and nothing else. The Aurora striped set is at most the 21 most recent files under the audit prefix whether or not you pass it, so a striped read never suggests it. It states how many files it actually took (the cap only when the cap bit) and points at the cloudwatch source, which reads the exported log group and reaches history the RDS file API no longer lists. A chain read that already had include_rotated set and still hit the 20-file cap does not suggest re-running with it either.
    • A scope that could not be listed is reported as unknown, not as the cap. If the audit directory itself cannot be read (a permission, a transient EACCES/EMFILE, an NFS/EFS blip on a remote audit mount), the read falls back to the primary file, names the listing error, and says its rotated scope is UNKNOWN. It does not say the 20-file cap bit, and it does not tell you that re-running changes nothing: re-running after fixing the directory is exactly what surfaces the rotated files.
    • A full page is only "unread" where the reader actually stopped. The local-file and classic RDS readers break their file loop when the record cap fills, leaving older rotated files unopened; they earn that statement. The Aurora striped set and the CloudWatch reader do not: they read their whole scope, sort by record timestamp and return page one, so a full page there is paging, and the remedy is offset. Every reader does have a cap that stops it short: the 100,000-matched-record scan cap, per file on the file readers and across the set on the striped and CloudWatch ones. Each says so where it fires, including that offset cannot page past it (every page re-runs the same capped scan), and only when a record was actually excluded, so a file holding exactly 100,000 matched records is read to its end and reported as such. A file clipped by that cap is never reported as "read in full". CloudWatch's coverage floor comes from the log group's retention policy and creation time, not from the records read, so it is reported either way: cap or no cap, you get the floor or the explicit "unknown".
  • Zone-less timestamps are resolved against the server, not assumed. The MariaDB server_audit family stamps records in server-local time with no zone marker. On a live local read dbtrail probes the source's OS-clock UTC offset (the clock the plugin actually stamps with, independent of the SQL session's time_zone) for the requested window and normalises. When the offset cannot be probed (an offline read, a denied query), the timestamps are left verbatim and the read says so.

The statement itself (query_text)

Independent of everything above, MySQL can write the originating SQL statement into the binlog itself: set binlog_rows_query_log_events=ON (MariaDB: binlog_annotate_row_events, on by default). The open-source core then indexes the statement durably next to each row change. This is the highest-fidelity "what", available even when no identity source can supply the "who". who-changed shows it alongside the attribution. dbtrail-ee doctor checks this flag too.

What no tool can tell you

Worth being clear about, because these are limits of MySQL and of network reality, not of dbtrail, and not fixable by any product:

  • Behind a connection pooler or proxy (ProxySQL, RDS Proxy, app-side pools): the database sees the pool's backend session. The database username usually survives, but the client host is the proxy's, and with multiplexing many application users share one backend connection. No server-side evidence can split them apart. If you need per-application-user attribution behind a pool, it has to come from the application's own logs.
  • Older than your evidence. No audit log ⇒ no history. Audit log rotated away ⇒ that window is gone. Nobody can read a deleted record.
  • From a replica's binlog: connection numbers belong to the replica's replication applier, not the original client. Run who-changed against an index captured from the primary.
  • A determined insider: a privileged session can set a fake pseudo_thread_id. The binlog connection number is corroborating evidence, not courtroom proof; dbtrail's answers say this in their notes.
  • PostgreSQL sources: Postgres's logical replication stream carries no connection identity at all, so who-changed does not exist for PostgreSQL-source capture.

The commands

CommandWhat it answersNeeds
dbtrail-ee who-changed"Who changed these rows?" The main forensic command. Attributes indexed changes via audit log → live sessions → identity cache, labels each answer, explains every gap. Without --source-dsn only index-side evidence is used.--index-dsn; --source-dsn recommended
dbtrail-ee user-activity --user X"What is this user running right now / very recently?" A live view, short window, no time filter (see limit 2 above).--source-dsn
dbtrail-ee connection-history"Who is connected right now?" (its fallback SQL adds cumulative per-account connection totals to run yourself)--source-dsn
dbtrail-ee attribution-status"Is identity capture actually running, and what has it retained?" See below--index-dsn

All accept --format json. (Looking for DDL history? That is served durably from the index, not from performance_schema: dbtrail-ee query --event-type ddl.)

The identity cache runs automatically under every capture daemon (dbtrail-ee up, stream and agent, plus the dbtrail-console-ee web console's watch and control-plane monitor daemons, for MySQL-family sources). The BINTRAIL_ATTRIBUTION_RETENTION environment variable controls it: a Go duration, 24h default, 0 disables. It replaces the retired --attribution-retention flag from the pre-EE core with identical semantics. Identities are stored in the index as a ledger (session_history, created automatically by the poller): one row per continuously observed session interval per connection id, so a reused id appends history instead of overwriting it. An event that falls strictly inside an interval attributes at exact. A pre-existing connection_cache snapshot is migrated into the ledger on first run (its rows are capped at corroborated: the snapshot never recorded session ends) and the old table is dropped. Intervals are swept hourly per the retention window.

With an audit plugin, the ledger fills itself from the log too. The same daemon runs a second collector: every minute it reads the audit log since its last checkpoint (local file, the RDS file API, or CloudWatch; the same sources who-changed reads on demand) and persists each session's CONNECT..DISCONNECT lifetime into the ledger with the endpoints the log proved. That matters for one reason: audit logs rotate in hours on RDS, but a ledger interval lives as long as your retention. Set BINTRAIL_ATTRIBUTION_RETENTION=2160h and a bracketed session from ten weeks ago still attributes at exact, long after the log itself is gone. The two collectors are additive (the poller catches what an unreadable log cannot; the log catches sub-poll-interval sessions and exact endpoints); retention stays the one knob for both, and statement contents are never persisted by this path (only session lifecycle).

Is capture actually running?

Identity capture is a background job inside a capture daemon, and it fails quietly by design: it must never take the stream down. So a deployment where it never started (no licensed forensics feature, a source the poller cannot reach, a daemon pointed at a different index) behaves exactly like a healthy one, until someone asks "who changed this?" months later and the evidence is gone.

Two ways to tell, neither of which requires guessing:

dbtrail-ee attribution-status --index-dsn "$IDX"
Attribution capture (session_history)
  Status:            capturing (last sighting 1s ago)
  Retained:          1284 interval(s) across 412 connection id(s)
  Live sessions:     37 (of 40 interval(s) with no witnessed end)
  History starts:    2026-07-24T12:00:00Z (24h0m0s ago)
  Newest sighting:   2026-07-25T11:59:59Z (1s ago)
  Collectors:        audit_log 84 (3s ago) · performance_schema 1200 (1s ago)
  Retention:         24h0m0s (BINTRAIL_ATTRIBUTION_RETENTION, as resolved by this command)
  Index server time: 2026-07-25T12:00:00Z

The verdict is read off the ledger itself: every poll extends the last_seen of every open session interval, so a recent sighting means a poller is running right now. Ages are measured against the index server's clock, so a skewed workstation cannot report a healthy poller as dead. STOPPED and NOT CAPTURING come with the checks to run, in order. An empty ledger (capture ran, retention swept it) is reported differently from a missing one (no attribution daemon has ever run here), because the two need different fixes. --format json gives the same content for monitoring.

Second signal, in the daemon's own log: a running poller prints one line every five minutes.

level=INFO msg="session-history: capturing" window=5m0s polls_ok=600 polls_failed=0 open_intervals=37 consecutive_failures=0

A poller that is running but getting nowhere (polls_ok=0 polls_failed=600: an unreachable source, a revoked grant) is a different incident from silence, which means the poller exited; the warning that named the reason is immediately above it in the log.

Asking from an AI client (MCP)

The same attribution engine is exposed as MCP tools on the console's /mcp endpoint, so a client already connected to dbtrail (Claude Desktop, Claude Code, any MCP client) can ask in words:

"Who changed row 42 in shop.orders this morning?"

ToolAnswers
who_changedthe main one: attributes indexed changes, with source + confidence per answer
forensics_capabilitieswhat the source server actually offers, and what to enable when confidence is weak
user_activitya user's recent statements from live performance_schema
connection_historywho is connected right now

Two properties worth knowing, because they are what make the tools safe to hand an agent:

  • They read the server you selected. A tool resolves its index through the console's own routing (/mcp/{server}), and it takes no DSN parameter at all. An MCP client cannot point the daemon at another database.
  • The three live-source tools refuse clearly when the selected server has no source DSN configured (the console's boot entry, for one), naming where to configure one rather than returning an empty answer.

who_changed works even with no source configured: it still returns which rows changed and when, and its notes say which tiers it could not consult.

Registration is the license gate here too: an unlicensed binary does not expose these tools at all. See Claude integration for connecting a client.

Sub-second precision

An indexed event's event_timestamp resolves to one second; that is all the binlog's common header carries. On a busy server that is not enough to say which session held a connection id at the moment of a change: sessions open and close inside one second, and both sides of the comparison round to it.

Two things now close that gap:

  • dbtrail captures the transaction's commit instant in microseconds (commit_ts_us, from the GTID event on MySQL 8.0.1+; no source configuration needed, gtid_mode may be off). It appears in the who-changed answer next to the second-resolution timestamp.
  • Aurora Advanced Auditing stamps its audit records at epoch-microseconds. Where both sides are precise, session containment is evaluated microsecond-exact: a connection id reused twice inside one second resolves to the right identity, at exact confidence, instead of the heuristic "two candidates, picked the likelier" it used to be.

Where the other side is not precise (upstream MariaDB and RDS audit logs, and the ledger's own timestamps), dbtrail makes every comparison at that side's resolution. A bound stored as 10:00:03 stands for the whole second it names, so an event at 10:00:03.7 is still inside it. This is deliberate: comparing a microsecond event against a second-truncated bound would produce confident wrong exclusions from precision only one side has. commit_ts_us is NULL on MariaDB, on MySQL before 8.0.1, and for events indexed before the column existed. There, nothing changes at all.

Other surfaces

Agent (BYOS): the agent WebSocket channel answers the forensics_capabilities, forensics_enrich, forensics_activity, forensics_users, and forensics_audit_log commands. An unlicensed binary answers them with the standard "unknown command type" error.

Web console: the dbtrail-console-ee binary ships a Forensics view: the "who changed this?" surface in the browser, gated on the forensics license feature. It reads the same attribution tiers as the CLI, and the connection-identity poller runs under its watch/monitor daemons (above) to populate the cache. Under RBAC, the view requires analyst or above. See Running the console.

Privileges

The user in --source-dsn needs SELECT on performance_schema. Reading a local audit log needs filesystem access to the log path; reading RDS/Aurora audit logs needs the two IAM actions listed above. As everywhere in dbtrail, everything here is read-only: doctor prints remediation for you to apply, and never executes it.

On this page